
 XM
XM Bybit
Bybit Binance
 Robinhood
 Webull
 IC Markets
 Pepperstone
 OKX
OKX Vantage
 VT Markets
 BingX
BingX Gate.io
 Kucoin
 MEXC
MEXC Exness
 Bitget
The guide to multi-timeframe analysis using the top-down approach when trading will allow traders to evaluate long-term trends while spotting ideal entry points on smaller timeframes. After deciding on the timeframes for forex trading analysis, traders can then proceed with technical analysis by using multiple timeframes to confirm or invalidate their trading trend.
Key points to note:
- What is multi-timeframe analysis?
- Which forex timeframes can be applied in multi-timeframe analysis?
- Multi-timeframe analysis techniques for day traders
- Multi-timeframe analysis techniques for swing traders
1. WHAT IS MULTI-TIMEFRAME ANALYSIS?
Multi-timeframe analysis, or multiple timeframe analysis, is the process of examining the same currency pair under different timeframes. Typically, a larger timeframe is used to establish the long-term trend, while smaller timeframes are used to spot ideal entry points when entering the market.
The general rule is to use a ratio of 1:4 or 1:6 when switching between timeframes. The logic behind this approach is to detect smaller, more complex price fluctuations for identifying reasonable entry points when entering the market. That being said, focusing on extremely small timeframes is not beneficial, as most of the price fluctuations have little impact on the overall trade and may lead to unnecessary stress when the market is moving quickly.
For example, when viewing the trend on an hourly chart, traders can zoom in on the 10-minute (1:6) or 15-minute (1:4) chart to get appropriate entry points. The 10- or 15-minute chart provides signals for shorter-term developments, while the hourly chart is where future trade progress can be tracked.
2. GUIDE TO MULTI-TIMEFRAME ANALYSIS?
Many traders, both new and experienced, want to know how to determine the best timeframes for forex trading. In general, traders should refer to the multi-timeframe analysis guide that fits:
- The amount of time available for trading each day
- The timeframes most commonly used to identify trade setups
For example, traders who scan the forex market using daily charts, but who only have an hour a day to monitor the charts, should use the daily timeframe for analysis and the 4H timeframe to find entry points. Those with more time to follow the market can take advantage of much smaller timeframes, as they can analyze the market and act quickly when opportunities arise.
2.1. Long-term Traders:
- Holding time: > 1 day
- Trend chart: Weekly
- Entry chart: Daily
2.2. Swing Traders:
- Holding time: < 1 day
- Trend chart: 4-hour
- Entry chart: Hourly
2.3. Scalpers:
- Holding time: < a few hours
- Trend chart: Hourly
- Entry chart: 15-minute
3. HOW TO CONDUCT MULTI-TIMEFRAME ANALYSIS TO FIND ENTRY AND EXIT POINTS
Start by selecting your preferred timeframe, then move up to the next higher timeframe. From there, you can make a strategic decision to buy or sell depending on whether the market is sideways or trending. Then you will return to your preferred timeframe (or even a lower timeframe) to make strategic decisions about entry and exit positions (stop-loss and take-profit levels).
3.1. Multi-Timeframe Analysis Techniques for Day Traders
Day traders typically have the whole day to monitor the charts. Therefore, they can trade with very small timeframes, such as one-minute, 15-minute, or hourly charts. Day traders identify their trade setups on the hourly chart and then zoom in to the 15-minute chart to spot ideal entry points.
- Trend timeframe: Hourly chart
- Entry timeframe: 15-minute chart
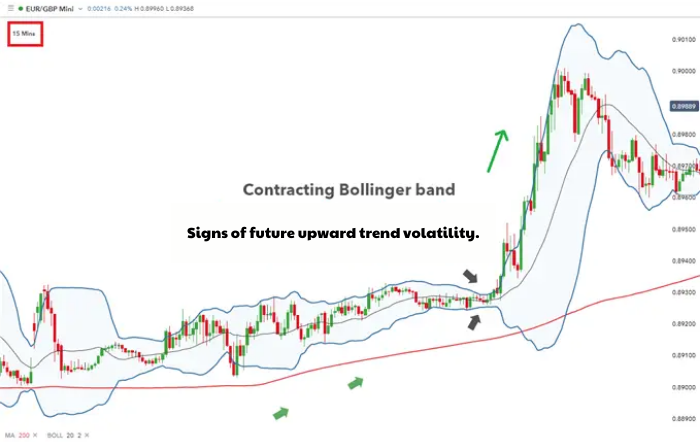
Day traders can look at the chart to identify the trend. If the price is primarily trading above the MA200 line and moving upwards, you can determine a buy position. Then, day traders can zoom in on the 15-minute or 4-hour chart to find ideal entry points.
The 1-hour EUR/GBP chart shows an uptrend:
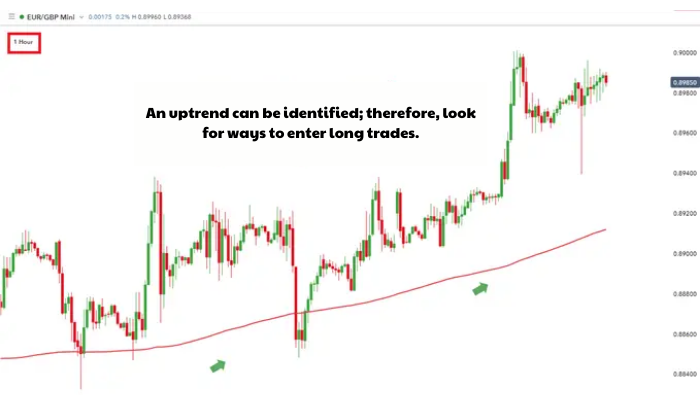
Day traders can look at the chart to identify the trend. The price is primarily trading above the MA200 and moving upward. Therefore, you can identify a buying position. Next, day traders can zoom into the 15-minute or 4-hour chart to find ideal entry points.
The EUR/GBP 1H timeframe chart shows an uptrend:
3.2. Multi-Timeframe Analysis for Swing Traders
Swing traders tend to spend less time monitoring charts compared to day traders—usually about an hour or less. Therefore, traders with this style will look at the daily chart to determine the overall trend and then move down to the 4-hour chart to identify entry points.
- Trend timeframe: Daily chart
- Entry timeframe: 4-hour chart
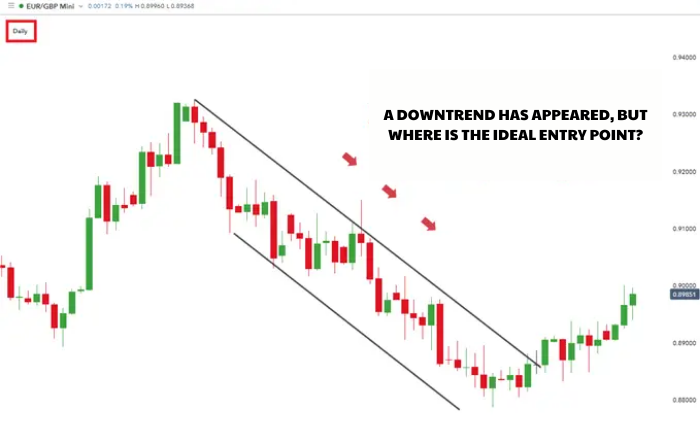
The daily chart for the EUR/GBP pair allows traders to spot a downtrend, but what is the ideal market entry point? Let’s move down to the 4-hour timeframe to clarify this further.
The daily EUR/USD chart shows a downtrend:
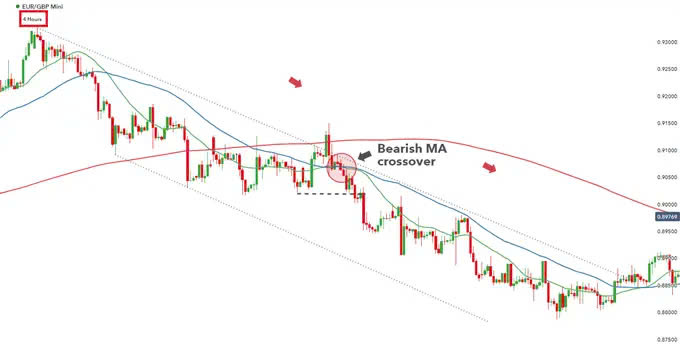
Moving down to the 4-hour chart, traders can look for sell signals. Note that the upper and lower channel lines are now displayed as faint dashed lines to keep the chart clear. After a failed breakout, the price will drop back within the trading range. A higher failed bullish move further strengthens the case for a sell trade.
The price is trading below the 200-day SMA, and when it returns within the range, a bearish crossover will occur as the 20 MA line (green line) crosses below the 50 MA line (blue line), providing entry signals.
The 4-hour EUR/USD chart favors a sell position.
4. SUMMARY
In today’s article, Forex has shared with you the concept of multi-timeframe analysis, a guide to using multi-timeframe analysis, and how to apply this method to find entry and exit points effectively. We hope that the information we’ve provided will be helpful in your forex trading and investment journey.
Wishing you success in your trading career!!!
- t.me/finance_solutes
- Website: https://finance-solutes.com
- Hotline: +1 929 5636 439 ( Hotline )
- 26 Broadway, Suite 934, New York, 10004, US
