
 XM
XM Bybit
Bybit Binance
 Robinhood
 Webull
 IC Markets
 Pepperstone
 OKX
OKX Vantage
 VT Markets
 BingX
BingX Gate.io
 Kucoin
 MEXC
MEXC Exness
 Bitget
Pivot Point, also known as the “Turning Point,” is a familiar term for professional traders. Some even regard it as one of the most effective Forex trading tools. It is a crucial technical indicator that helps traders identify price levels at which the market is likely to experience significant movements—either continuing the initial trend or reversing it.
So, what is a Pivot Point? How can you apply Pivot Points in Forex trading? Let’s explore this concept with Forex in this series of Forex knowledge articles. Let’s get started!
1. WHAT IS A PIVOT POINT? UNDERSTANDING PIVOT POINTS IN FOREX
Professional forex traders and market makers use Pivot Points to determine potential support and resistance levels. A Pivot Point and its associated support/resistance levels are areas where price direction might change.
In many ways, Pivot Points in forex trading are similar to Fibonacci levels. Since so many people watch these levels, they almost become self-fulfilling.
1.1. Pivot Point
A Pivot Point is a technical indicator used to identify the overall market trend across different timeframes on a chart. It is simply the average of the high, low, and close prices from the previous trading day. Theoretically, if the price is above the Pivot Point, it indicates a bullish sentiment, while if it is below, it reflects a bearish sentiment. Therefore, Pivot Points are calculated to determine market psychology levels where sentiment might shift from bullish to bearish and vice versa.
1.2. Structure of Pivot Points
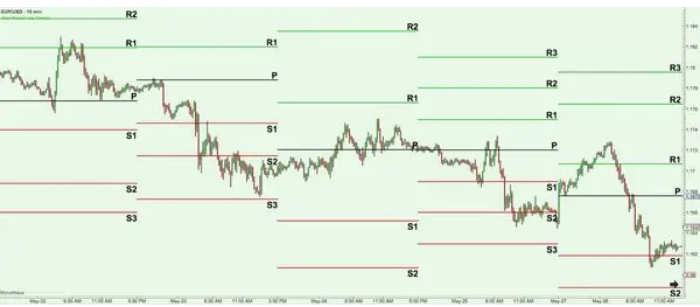
Pivot Points consist of seven primary lines: the main line, also called the Pivot Point (PP); three lines below PP labeled as S1, S2, S3 (three support levels); and three lines above PP labeled as R1, R2, R3 (three resistance levels). You can visualize this more clearly with the Pivot chart below:
1.3. Differences Between Pivot Points and Fibonacci Retracement/Extension
| PIVOT POINTS | FIBONACCI RETRACEMENT/EXTENSION |
|---|---|
| Calculated using the average of previous periods’ high, low, and close prices. | Based on fixed ratios derived from the Fibonacci sequence. |
| Relies on support and resistance levels of the previous period. | Relies on support and resistance levels of different waves. |
The main difference is that Fibonacci requires subjective decisions regarding the selection of swing highs and swing lows, whereas Pivot Points are calculated using a standardized method. Forex traders often use the same approach to compute Pivot Points, making these levels consistently relevant across the board. You should also pay attention to these levels as many traders monitor them closely.
Pivot Points are particularly useful for short-term traders. Similar to traditional support and resistance levels, forex traders can adopt two main strategies: bounce or breakout trading at these levels.
Bounce Strategy: This strategy leverages Pivot Points to pinpoint potential reversal points. Traders using this approach view Pivot Points as areas where they can place buy or sell orders.
Breakout Strategy: This strategy uses Pivot Points to identify critical price levels that must be breached to classify a movement as a true breakout.
Below is an example of Pivot Points plotted on a 1-hour chart of the EUR/USD pair:
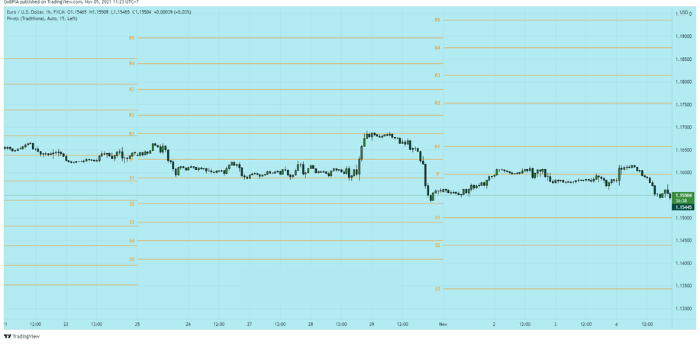
In which:
PP = Pivot Point
S = Support: Support level
R = Resistance: Resistance level
2. HOW TO CALCULATE PIVOT POINT
Pivot points and related support and resistance levels are calculated using the opening price, highest price, lowest price, and closing price of the most recent trading session.
The forex market operates 24 hours; thus, most traders use the New York closing time of 5:00 PM EST as the previous day’s closing time.
Pivot Point (PP) = (Highest Price + Lowest Price + Closing Price) / 3
The support and resistance levels are then calculated as follows:
First Support and Resistance Levels |
First Resistance (R1) = (2 x PP) – Lowest Price |
| First Support (S1) = (2 x PP) – Highest Price | |
Second Support and Resistance Levels |
Second Resistance (R2) = PP + (Highest Price – Lowest Price) |
| Second Support (S2) = PP – (Highest Price – Lowest Price) | |
Third Support and Resistance Levels |
Third Resistance (R3) = Highest Price + 2(PP – Lowest Price) |
| Third Support (S3) = Lowest Price – 2(Highest Price – PP) |
Remember that some forex charting software plots intermediate levels. Essentially, these are smaller levels between the main pivot point and the support/resistance levels.
If you hate calculations, don’t worry—you won’t have to do these yourself. Most charting software will calculate them automatically. Just make sure you configure your settings to use the correct time and closing prices.
Calculating pivot points can be helpful, especially if you want to “backtest” and see how well the pivot levels have held up in the past.
3. HOW TO USE STANDARD PIVOT POINT TRADING
3.1. Filtering Trades by Main Trend
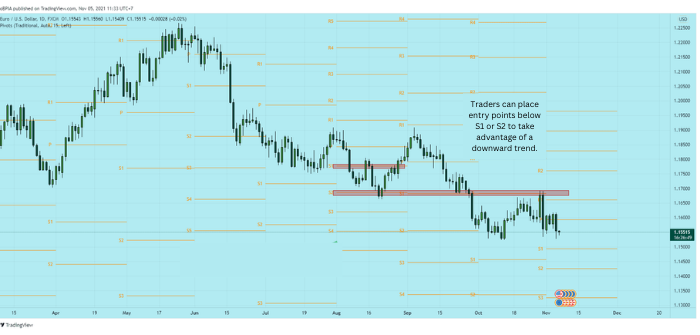
In well-established downtrends, you can gain a larger number of pips compared to trading against the main trend during upward retracement waves. You can use support and resistance levels to look for strong breakout trades that align with the main market trend.
As you can see in the chart below (marked in red), the S1 and S2 zones act as resistance levels in the current downtrend. Forex traders will look to place orders a few pips below these levels to capture further downward moves.
Below is a daily chart of the EURUSD pair:
3.2. Ideal Entry Points with Standard Pivot Points
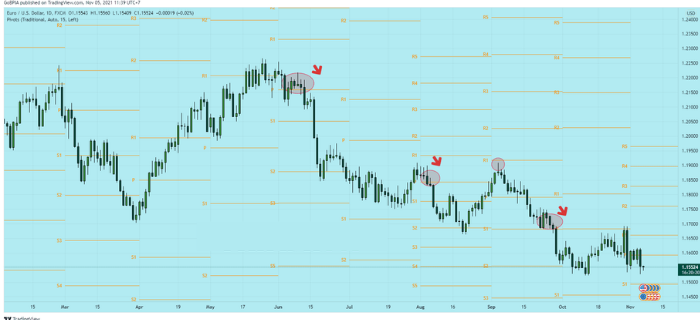
Classic pivot points often suggest attractive entry zones when trading with the trend. The chart below clearly shows a downtrend and how the price retraces before breaking down sharply. Traders can place pending orders at these levels or simply sell when the price reaches the pivot point and shows a bearish signal.
Below is an example of a daily chart of the EURUSD pair with pivot point levels:
4. 3 OTHER TYPES OF PIVOT POINTS
The standard method for calculating pivot points is not the only way to determine these levels. Traders have developed methods to enhance the basic pivot points. As a result, there are various alternative ways to calculate these points.
4.1. Woodie Pivot Points
- R2 = PP + Highest Price – Lowest Price
- R1 = (2 x PP) – Lowest Price
- PP = (Highest Price + Lowest Price + 2 x Closing Price) / 4
- S1 = (2 x PP) – Highest Price
- S2 = PP – (Highest Price – Lowest Price)
As you can see, this calculation differs significantly from the standard method. Additionally, to calculate the corresponding support and resistance levels, you will use the difference between the previous day’s highest and lowest prices, also known as the range.
Below is an example of how Woodie Pivot Points are applied to the EURUSD pair.
Take a look at the Woodie Pivot Points in the illustration below:
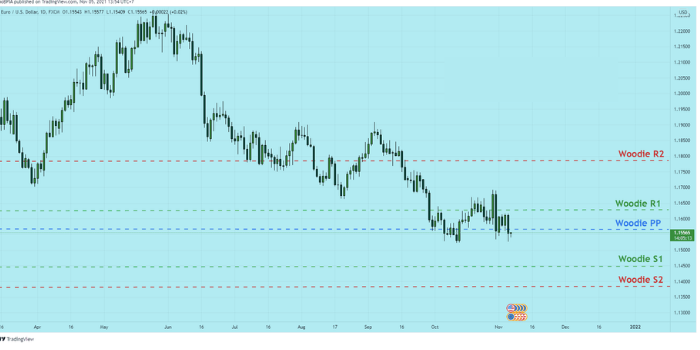
They have different calculation formulas, so the levels derived using the Woodie formula will differ from those of the standard method.
In any case, when resistance turns into support (and vice versa), if you choose to use the Woodie formula, you should monitor these levels as they can become prices of interest.
4.2. Camarilla Pivot Points
- R4 = C + ((H – L) x 1.5000)
- R3 = C + ((H – L) x 1.2500)
- R2 = C + ((H – L) x 1.1666)
- R1 = C + ((H – L) x 1.0833)
- PP = (H + L + C) / 3
- S1 = C – ((H – L) x 1.0833)
- S2 = C – ((H – L) x 1.1666)
- S3 = C – ((H – L) x 1.2500)
- S4 = C – ((H – L) x 1.5000)
Where:
- C = Closing Price
- H = Highest Price
- L = Lowest Price
The Camarilla formula is similar to Woodie’s formula. It also uses the previous day’s closing price and range to calculate support and resistance levels.
The only difference is that you calculate for 8 key levels. These include 4 resistance levels and 4 support levels, each multiplied by a specific multiplier.
The concept of the Camarilla pivot point is based on the idea that prices tend to naturally revert to the mean, or in this case, the previous day’s closing price. You should buy or sell when the price reaches the third support or resistance level.
However, if the price breaks through S4 or R4, it indicates a strong intraday trend, and it may be time to follow that trend!
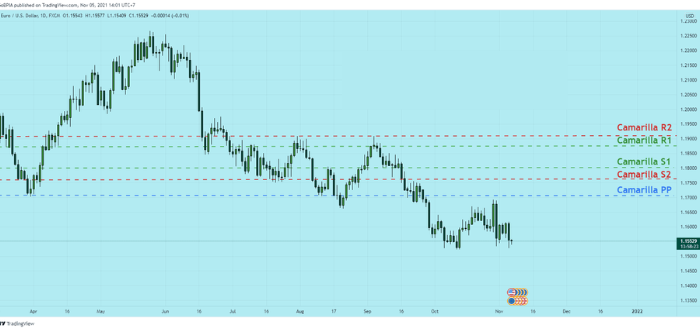
As you can see from the chart above, the closing price is given more emphasis than the pivot point. Therefore, the resistance levels can be below the pivot point, or the support levels can be above these points.
4.3. Fibonacci Pivot Points
- R3 = PP + ((H – L) x 1.000)
- R2 = PP + ((H – L) x 0.618)
- R1 = PP + ((H – L) x 0.382)
- PP = (H + L + C) / 3
- S1 = PP – ((H – L) x 0.382)
- S2 = PP – ((H – L) x 0.618)
- S3 = PP – ((H – L) x 1.000)
Where:
- C = Closing Price
- H = Highest Price
- L = Lowest Price
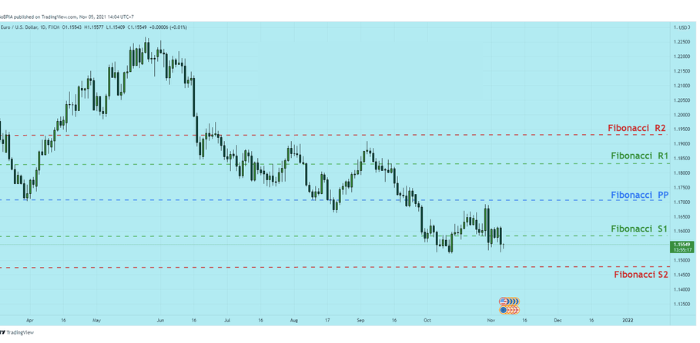
First, the Fibonacci pivot points are determined the same way as the standard method.
Next, the range of the previous day is multiplied by the corresponding Fibonacci level. Most traders use the 38.2%, 61.8%, and 100% retracement levels in their calculations.
Finally, by adding or subtracting the figures you obtain, you have your Fibonacci pivot indicator levels!
5. GUIDE TO SETTING UP PIVOT POINTS
5.1. How to Set Up Pivot Points on MT4
From the Pivot Point calculation formula above, it’s clear that the calculations can be quite complex and time-consuming. If you dislike the calculations, don’t worry, because you won’t have to do them yourself. Most charting software will automatically handle these calculations for you. Just make sure to set up your settings to use the correct time and closing price.
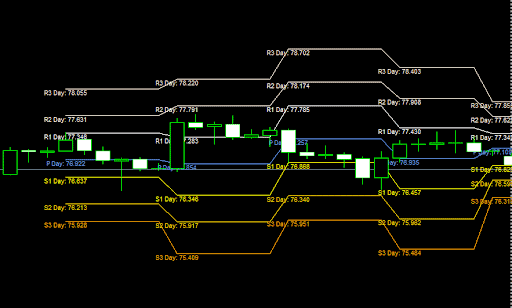
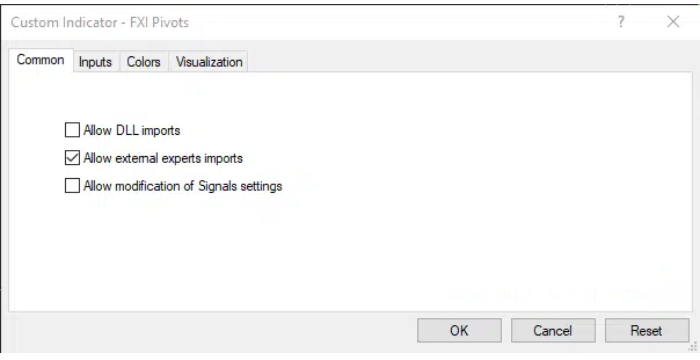
Currently, MT4 software does not have a built-in Pivot Point indicator. Therefore, if you want to use this indicator, you’ll need to install the Pivot Point indicator on your MT4 platform. First, you need to download the Pivot Point indicator for MT4 to your computer here:

Now that you have successfully downloaded the Pivot Point indicator to your computer, installing it on your MT4 trading platform is very simple. Just follow these steps:
Step 1: Download the Pivot Point Indicator => Open MT4 Software
After successfully downloading the Pivot Point indicator for MT4, you need to extract the files. Then, open your MT4 software.
Step 2: In MT4, select File => Open Data Folder
On the MT4 platform’s toolbar, select File, then choose Open Data Folder.
Step 3: Select MQL4
After selecting Open Data Folder, you will need to go to the MQL4 folder.
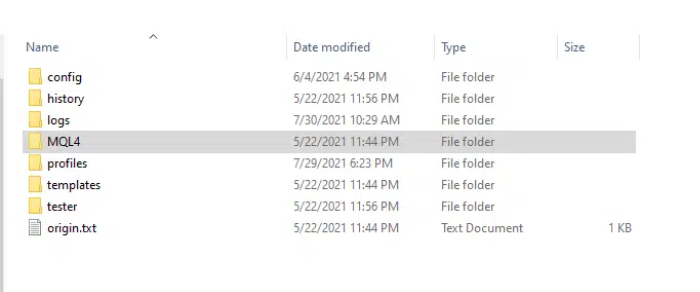
Continue by selecting Indicators.
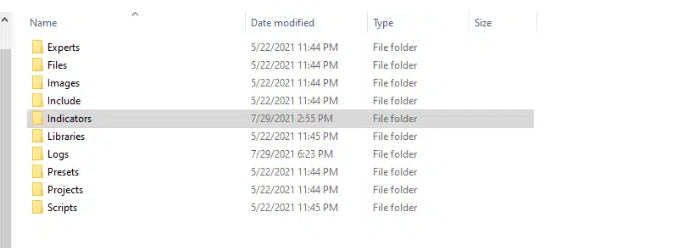
Next, copy the extracted Pivot Point indicator file and paste it into the Indicators folder.
This technical indicator will then appear in the Indicators folder, as you can see.
Step 4: Return to MT4, select Navigator => Indicators
Go back to the MT4 software, and in the Navigator panel, select Indicators.
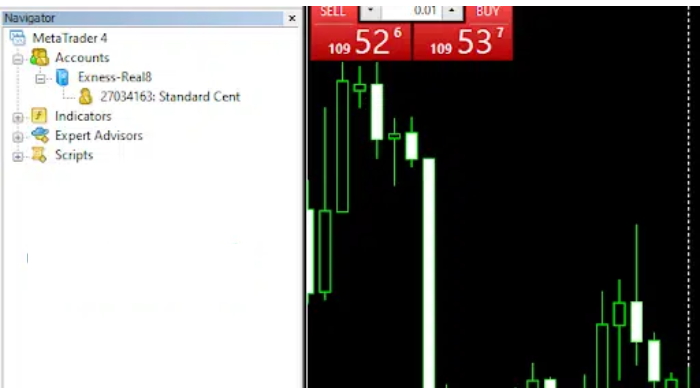
At this point, a list of the indicators installed on your MT4 software will appear. However, the Pivot Point indicator you just installed may not have been updated yet.
There are two ways to resolve this:
- Close the MT4 software and reopen it. Then, in the Navigator panel, select Indicators — the Pivot Point indicator should now appear.
- From the Navigator panel, right-click and select Refresh — the Pivot Point indicator will now appear.
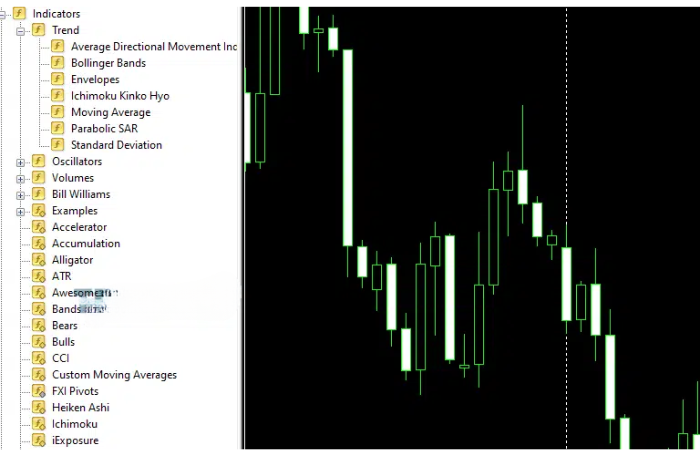
Now, you’ve successfully installed the Pivot Point indicator on your MT4 software; it’s really simple and easy, right?
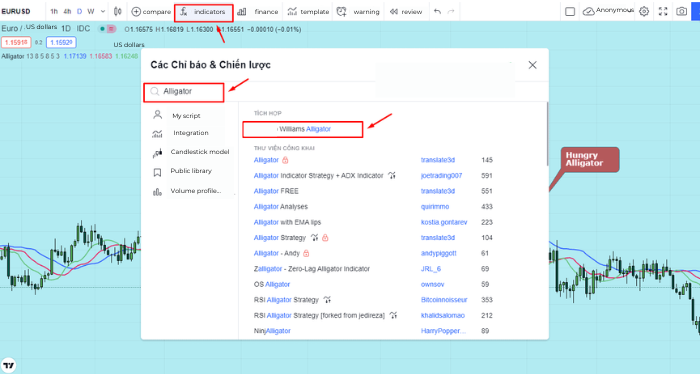
So, you’ve successfully added the Pivot Points indicator on the TradingView platform. It’s really simple, right!
5.2. How to Set Up Pivot Points on TradingView
Now, use the functions of this indicator and start trading according to your strategy!
6. IMPORTANT NOTES WHEN USING PIVOT POINTS IN FOREX
From the formula for calculating Pivot Points, you can see that it uses 3 levels: the closing price, the highest price, and the lowest price for calculations. Therefore, the Pivot Point indicator is highly valued when closely monitoring price levels near the current market price. This can minimize price lag compared to many other types of technical indicators.
Unlike trendlines, support, or resistance, Pivot Points remain the same across all time frames since they are calculated using just one formula. However, they are only valid for the current day, and the levels will change the next day, as R1, R2, S1, S2, etc., change daily.
7. SUMMARY
I hope the Forex knowledge in this article has helped you understand the concept of Pivot Points and how to identify them, along with the related aspects. The profit potential in the Forex market is enormous. Therefore, if you’re a newbie, gain experience by practicing trading as much as possible and learn from the trading styles of successful investors to turn them into your own personal strategy!
Wishing you successful trading!!!
- t.me/finance_solutes
- Website: https://finance-solutes.com
- Hotline: +1 929 5636 439 ( Hotline )
- 26 Broadway, Suite 934, New York, 10004, US
