
 XM
XM Bybit
Bybit Binance
 Robinhood
 Webull
 IC Markets
 Pepperstone
 OKX
OKX Vantage
 VT Markets
 BingX
BingX Gate.io
 Kucoin
 MEXC
MEXC Exness
 Bitget
Stochastic Oscillator Indicator and How to Use It Effectively
The Stochastic Oscillator is a highly useful technical analysis indicator when evaluating momentum or trend strength. Presented with clear buy and sell signals, this oscillator (and oscillators in general) provides a straightforward view of market dynamics. However, relying solely on its signals without deeper understanding of the Stochastic indicator or oscillator can lead to disappointing results.
To avoid undesired trades, new traders need an in-depth understanding of the Stochastic Oscillator’s fundamentals and how it relates to current market conditions. Hence, in today’s article, let’s dive deeper into this indicator with TradaFX!
Let’s get started!
1. OSCILLATORS
Before exploring the Stochastic Oscillator in detail, it’s essential to understand what an oscillator is.
Most indicators in this category (including the Stochastic) are composed of two bands displayed at the bottom of a price chart. These bands, calculated using specific formulas, oscillate to extremes either at the upper or lower boundaries. This feature helps traders identify momentum and the buying or selling strength in the market.
One critical reason why oscillators are invaluable for traders is their ability to measure momentum, i.e., the speed at which price changes compared to expectations or actual levels. This capability introduces concepts like divergence, convergence, or overbought and oversold conditions.
2. WHAT IS THE STOCHSTIC OSCILLATOR?
The Stochastic Oscillator, or simply “Stochastic,” is a momentum indicator developed by Dr. George Lane in the 1950s.
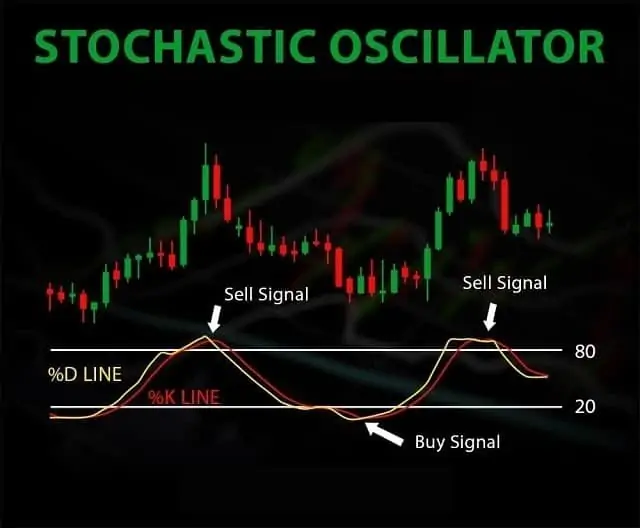
This technical indicator calculates whether an asset is overbought or oversold by comparing the price’s position within a specified time frame’s range of highs and lows. Essentially, it measures the most recent closing price as a percentage of the range (high – low) over a set period.
For instance, here’s an illustration with a practical example:

3. THE HISTORY OF THE STOCHASTIC OSCILLATOR
Before exploring the origins of the Stochastic Oscillator, let’s review some key highlights about George Lane – the creator of this technical indicator.
3.1. A Brief Biography of George Lane
George Lane (1921 – July 7, 2004) was a stock trader, author, educator, speaker, and technical analyst. He was a member of a group of traders in Chicago who developed the stochastic oscillator (also known as “Lane’s stochastic”). This is one of the core technical indicators widely utilized today by most technical analysts in the fields of forex and stock trading.
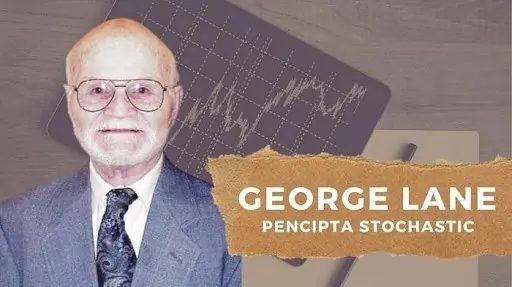
Lane was also the President of Investment Educators Inc. in Watseka, Illinois, where he taught investors and financial professionals both basic and advanced technical analysis methods. It was here that he popularized the Stochastic Oscillator among technical analysts.
George Lane had “an extensive academic background,” having attended three universities: Drake University, Washington and Lee University, and Northwestern University.
Lane began his 50-year career in financial markets with the brokerage firm EF Hutton & Co in the 1950s, under the mentorship of Joseph Granville. Later, George Lane joined the research team at Investment Educators – a company he would eventually own.
3.2. The Development of the Stochastic Oscillator
As mentioned earlier, the Stochastic Oscillator, also known simply as the Stochastic indicator, is widely used in forex and stock markets. This momentum indicator was developed by George C. Lane in the late 1950s. It combines the closing price of a specific asset with its high-low price range over a designated period.
At one point, while observing price fluctuations, George C. Lane noticed a lack of clear trends in the market, with dominant back-and-forth movements prevailing instead. This observation inspired him to create an indicator capable of capturing and analyzing these oscillations while signaling reversals in both upward and downward trends.
There is a theory suggesting that initially, there were multiple types of Stochastic Oscillators. The combination of price bar parameters and their derivatives was refined to determine the most accurate formula for calculating the Stochastic Oscillator.
Thus, George Lane emphasized that the Stochastic Oscillator does not adhere to price, volume, or any other factor. Instead, it strictly follows price speed and momentum. He also argued that speed or momentum always precedes price movements.
4. STRUCTURE AND FORMULA OF THE STOCHASTIC OSCILLATOR
What components make up the Stochastic Oscillator? When setting it up on a platform, are there specific parameters to be mindful of? Let’s explore the answers below.
4.1. What Is the Structure of the Stochastic Oscillator?
In the forex market, the Stochastic Oscillator comprises two lines:
– The Main Line: This is the %K line, representing the actual value of the oscillator for each session.
– The 3-Period Moving Average of the %K Line: This is the %D line, calculated using the 3-day Simple Moving Average (SMA).
– Additionally, there are two boundary lines set by default at levels 20 and 80. This means if the price crosses above the 80 level, it indicates an overbought condition. Conversely, if the price falls below the 20 level, it indicates an oversold condition. Traders use these levels to execute orders effectively.
Practical Example:
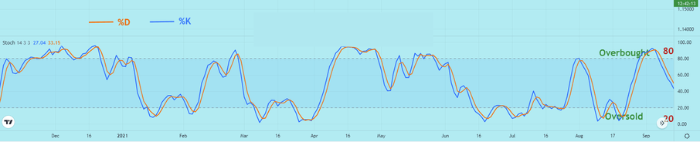
The %D line is derived from the %K line, meaning that the %K line moves faster, and therefore, the %D line is slower.
4.2. The Formula for Calculating the Stochastic Oscillator
The specific formula below is applied for a 14-period Stochastic indicator, but it can ultimately be adjusted to fit any desired time frame.
To calculate %K:
%K = [(C – L14) / (H14 – L14)] × 100
Where:
– C = Most recent closing price
– L14 = Lowest price over the 14-period cycle
– H14 = Highest price over the 14-period cycle
To calculate %D:
%D = Simple Moving Average of %K (usually a 3-period Simple Moving Average)
4.3. Setting Up the Stochastic Indicator
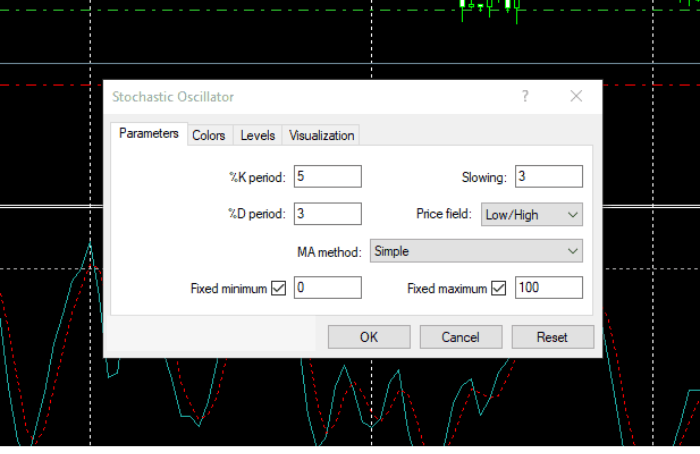
Below is the default setup for the Stochastic indicator on the MT4 trading platform:
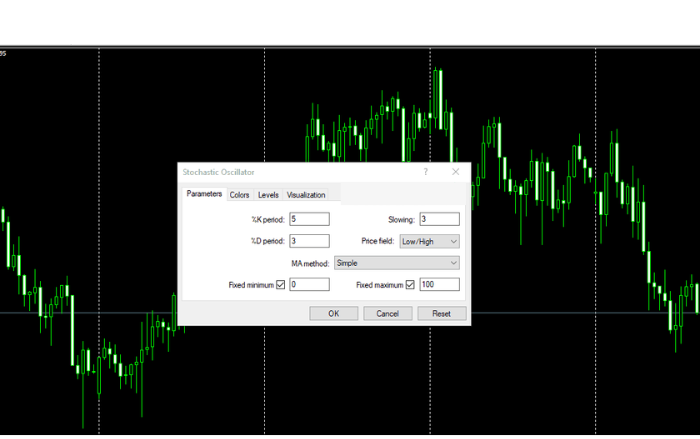
In the default settings on MT4/MT5, you can keep the parameters as “%K period = 5,” “%D period = 3,” and “Slowing = 3,” and it will still work effectively.
4.4. The Significance of the Stochastic Oscillator Line in Forex Trading
The Stochastic Oscillator has a limited range, meaning it always falls between 0 and 100. Because of this, it becomes a useful indicator for signaling overbought and oversold conditions.
Theoretically, when the oscillator exceeds 80, it indicates overbought conditions, and when it falls below 20, it signals oversold conditions. However, you cannot rely solely on these signals to conclude that a reversal is imminent; in fact, in many cases, the price trend continues even when overbought or oversold conditions appear. Therefore, you should combine this indicator with other indicators to more accurately determine trend changes.
Thus, in this way, the Stochastic Oscillator can be used to predict reversals when it shows bullish or bearish divergences.
5. SETTING UP THE STOCHASTIC OSCILLATOR ON MT4
To set up the Stochastic indicator on the MT4 platform, you have two methods as follows:
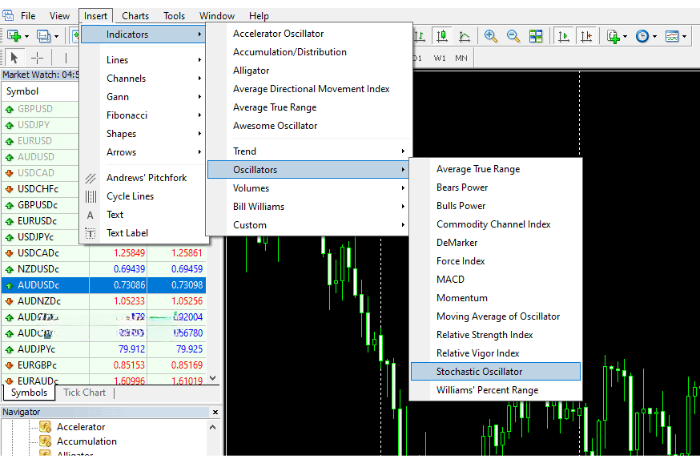
Method 1: Using the Menu Bar
- Open the MT4 trading software, and on the toolbar, select “Insert”
- Next, choose “Indicator,” then select “Oscillators,” and choose “Stochastic Oscillator”
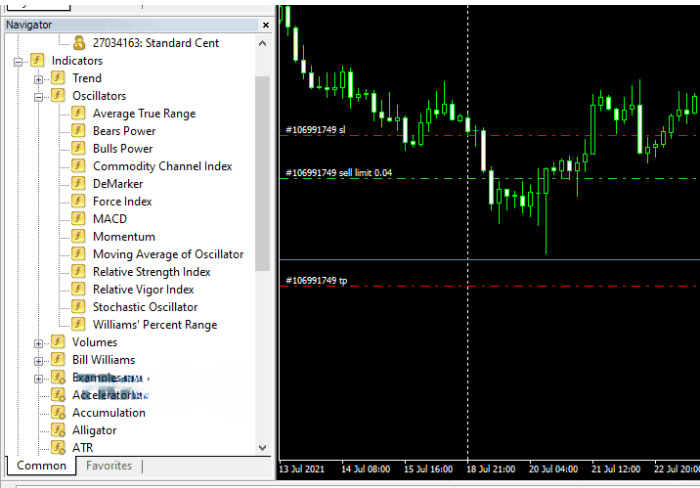
Method 2: Using the Navigator Panel
- In the Navigator panel, select “Indicators,” then continue by selecting “Oscillators,” and choose “Stochastic Oscillator”
Setting up the parameters for the Stochastic Oscillator on MT4
Parameters Section
- %K: This is the main solid line on the chart.
- %D: This is the moving average line of %K.
- Price field: The price of the selected candlestick, which can be the closing price, opening price, or the highest/lowest price of the trading session.
You can observe the actual image below:
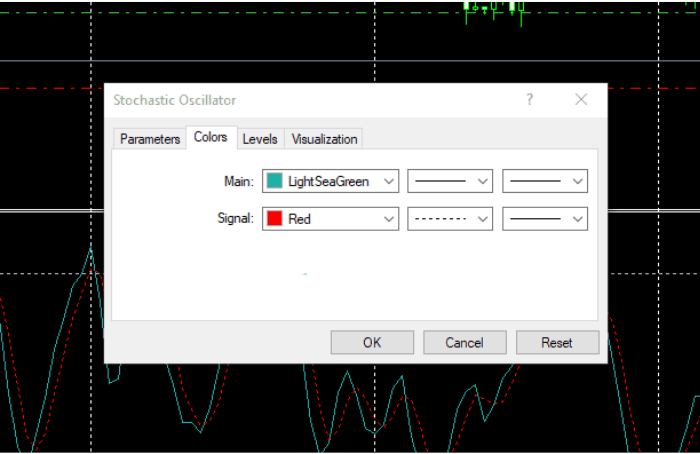
Colors Section
- This section is used to adjust the colors of the two lines, %K and %D.
- %K is the main line.
- %D is the signal line.
You can observe the actual image below:
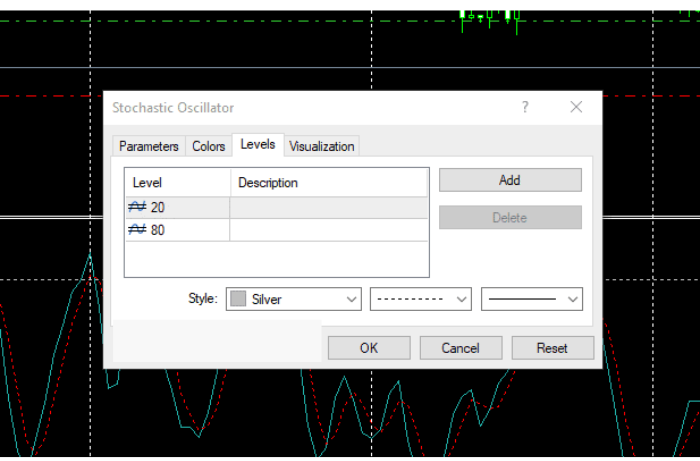
Levels Section
- These are the boundary levels of the Stochastic indicator.
- 20: The lower boundary, also known as the oversold region.
- 80: The upper boundary, also known as the overbought region.
You can observe the actual image below:
Visualization Section
- This section allows you to choose where the indicator will be displayed on the desired timeframes.
You can observe the actual image below:
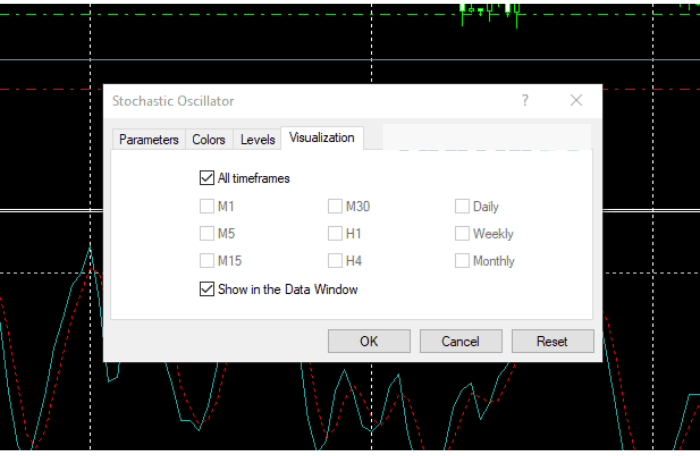
Finally, click “OK,” and you have successfully completed the setup and configuration of the Stochastic Oscillator indicator on MT4.
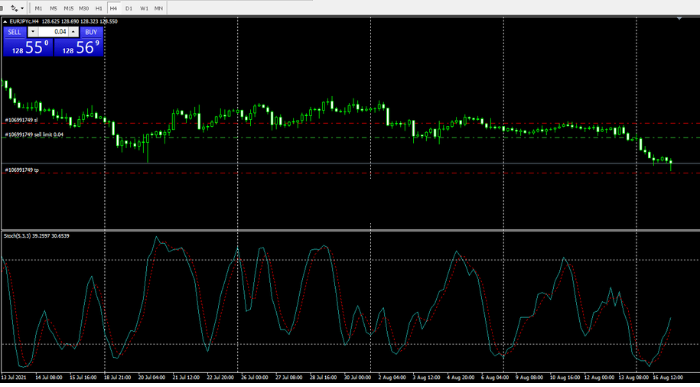
Here is the MT4 interface displayed after successfully adding the Stochastic Oscillator indicator:
6. HOW TO USE THE STOCHASTIC OSCILLATOR
In using the Stochastic indicator, the Stochastic Oscillator displays two lines that “oscillate” between two horizontal lines. The solid black line in the image below is called %K and is determined by a specific formula; while the red dashed line is the 3-period moving average of the %K line.
The price is considered to be “overbought” when both lines break above the upper horizontal line; and it is considered “oversold” when they break below the lower horizontal line.
The overbought line represents a price level that aligns with the top 80% of the recent price range (high – low) over a certain period – with the default period usually being “14.” Similarly, the oversold line represents a price level that aligns with the bottom 20% of the recent price range.
Timing for Entry Points
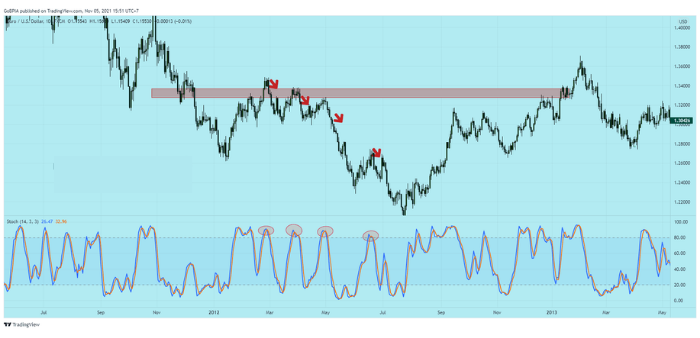
Additionally, the Stochastic Oscillator provides insights into timing entry points. When both lines are above the overbought line (80) and the %K line crosses below the %D line, this is considered a signal for a sell entry. Conversely, when both lines are below the oversold line (20) and the %K line crosses above the %D line, this is considered a signal for a buy entry.
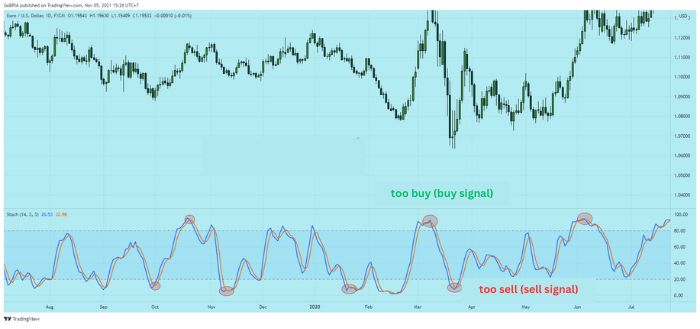
However, traders should not blindly trade based solely on overbought/oversold conditions. Traders need to understand the direction of the overall trend and choose a trading strategy that aligns accordingly.
A practical example with the illustration below:
When analyzing the EURUSD chart below, since the overall trend is bearish, traders should only look for sell entry signals at overbought levels. Only when the trend reverses or a proper trading range is established should traders look for buy signals under oversold conditions.
7. STOCHASTIC OSCILLATOR TRADING METHOD
Basically, like many other momentum indicators, the Stochastic Oscillator helps traders identify the OVERBOUGHT and OVERSOLD regions.
However, if this indicator is used alone in a forex trading strategy, it may not provide accurate results. The Stochastic indicator is truly useful when combined with other indicators or methods to filter out noise signals, thus helping traders identify reasonable entry and exit points.
7.1. Stochastic Oscillator Combined with RSI
This is one of the methods used by many traders. This strategy is also based on Dow’s theory, which states that prices must have a certain level of agreement. Both the Stochastic and RSI indicators are momentum indicators; therefore, if both show overbought or oversold signals, it will be a good opportunity to increase the likelihood of a successful trade.
Practical Example:
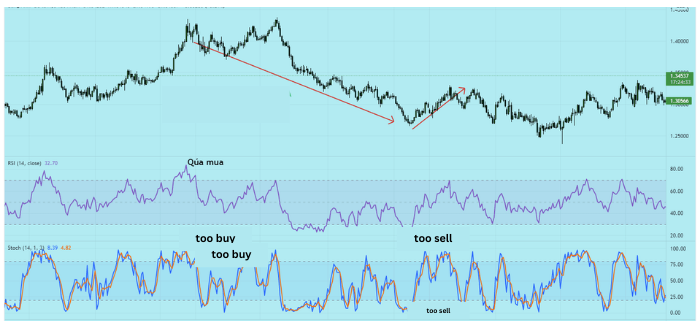
As you can observe in the example above, after both the Stochastic and RSI indicators show overbought signals, the price starts to move downward. This will be a good opportunity to increase the likelihood of success with a SELL setup. Conversely, when both the Stochastic and RSI indicators show oversold signals, this is a good opportunity to succeed with a BUY setup.
7.2. Stochastic Oscillator Combined with Candlestick Reversal Patterns in Forex Trading
In practice, candlestick reversal patterns are already very powerful on their own; therefore, when combined with the Stochastic indicator, it can significantly increase the success rate of a trade.
In areas where a candlestick reversal pattern appears, and the Stochastic indicator also gives overbought or oversold signals, this is the moment to enter a trade.
Illustrative Example:
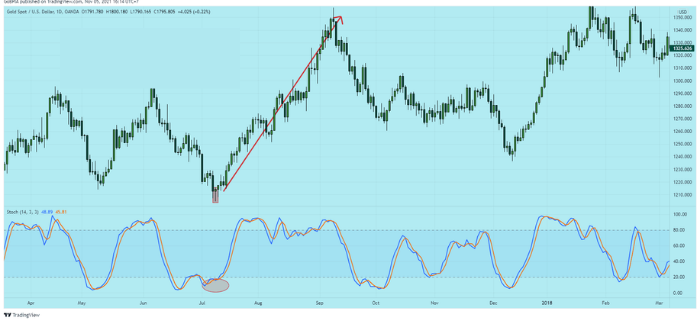
Looking at the example above, we can see the Hammer candlestick on the Daily timeframe combined with the Stochastic Oscillator showing an oversold signal. As a result, the price of gold increased as shown in the image above.
7.3. Stochastic Oscillator Combined with Price Patterns in Forex Trading
Similar to the methods of combining the Stochastic Oscillator with other indicators presented by Forex above, to use this method, you need to identify price patterns. When the pattern is formed, it is also the moment when the Stochastic indicator enters the overbought or oversold region. At this point, you just need to wait for the price pattern to break out and proceed with the trade.
Observe the example below to better understand the signal agreement between the Stochastic Oscillator and the price pattern.
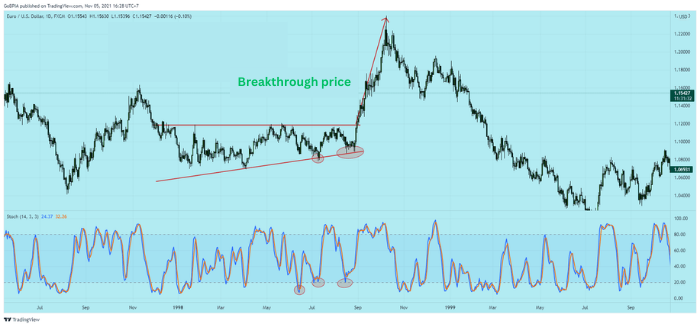
The illustration above shows the EURUSD pair on the Daily timeframe, forming an ascending wedge pattern. At this point, the Stochastic Oscillator has given an oversold signal, so if the price pattern and the Stochastic indicator are in agreement, the price will break through the upper side.
As you can observe, the price increased after breaking the upper side of the wedge pattern.
7.4. Stochastic Oscillator Combined with the Moving Average (MA) in Forex Trading
The Moving Average (MA) is one of the most versatile technical indicators and is widely used by traders because it helps identify or signal the end of a trend or a reversal.
The EMA (Exponential Moving Average) has more weight the larger the period. Therefore, if the price closes above the EMA, it is considered an uptrend; whereas if the price closes below the EMA, it is considered a downtrend.
Thus, you can imagine how to combine the EMA with the Stochastic Oscillator.
That is, if the price is above the EMA and the Stochastic Oscillator enters the oversold region, a Buy order will be placed. This will be further confirmed if reversal candlestick patterns or breakout patterns appear.
Conversely, if the price is below the EMA and the Stochastic Oscillator enters the overbought region, a Sell order will be placed. Observe the example below:
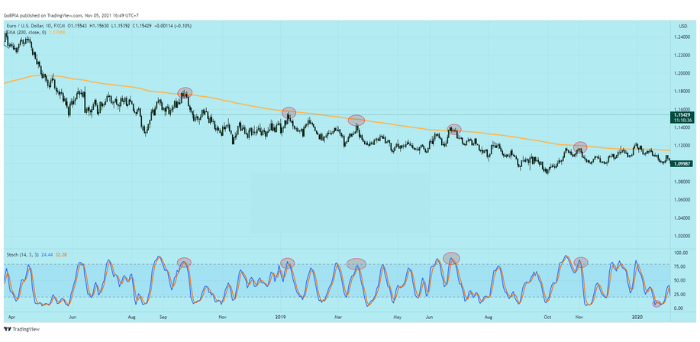
As you can see in the illustration above, the EURUSD repeatedly attempted to bounce off the EMA200 line but failed each time. When the price reached this point, the Stochastic Oscillator entered the overbought region, which led to a continuous decline in EURUSD.
8. ADVANTAGES AND LIMITATIONS OF THE STOCHASTIC OSCILLATOR IN FOREX
| Advantages of Stochastic | Limitations of Stochastic |
|---|---|
| – Clear entry and exit signals | – Can generate false signals if used incorrectly |
| – Signals appear frequently (depending on the time settings chosen) | – If trading against the trend, the price may remain overbought/oversold for an extended period |
| – Available on most chart types | |
| – Easy-to-understand concept |
9. SUMMARY
The Stochastic Oscillator is a great tool for identifying overbought and oversold conditions over a specific period. This technical indicator is favored by many traders when the price is trading within a range because the price itself is “oscillating,” leading to more reliable signals from the Stochastic indicator. However, traders need to avoid blindly shorting at overbought levels in uptrending markets and refrain from buying in downtrending markets solely based on the oversold conditions displayed by the indicator.
Wishing you successful trading!
- t.me/finance_solutes
- Website: https://finance-solutes.com
- Hotline: +1 929 5636 439 ( Hotline )
- 26 Broadway, Suite 934, New York, 10004, US
