
 XM
XM Bybit
Bybit Binance
 Robinhood
 Webull
 IC Markets
 Pepperstone
 OKX
OKX Vantage
 VT Markets
 BingX
BingX Gate.io
 Kucoin
 MEXC
MEXC Exness
 Bitget
For traders, especially those who follow technical analysis, the ability to read and analyze candlestick charts is one of the most critical skills. Learning how to read Forex Charts is one of the first steps you need to take if you wish to engage in trading. This article will guide you through how to read and analyze the three most common types of charts that traders frequently use.
1. FOREX CHARTS
A Forex chart is a visual representation showing how the price of a currency pair changes over time. Prices are plotted on the vertical Y-axis, while time is illustrated on the horizontal X-axis. You can customize the timeframe displayed on the chart, ranging from minutes to weeks, months, or even years.
Below is an example of a daily candlestick chart on the MT4 platform:
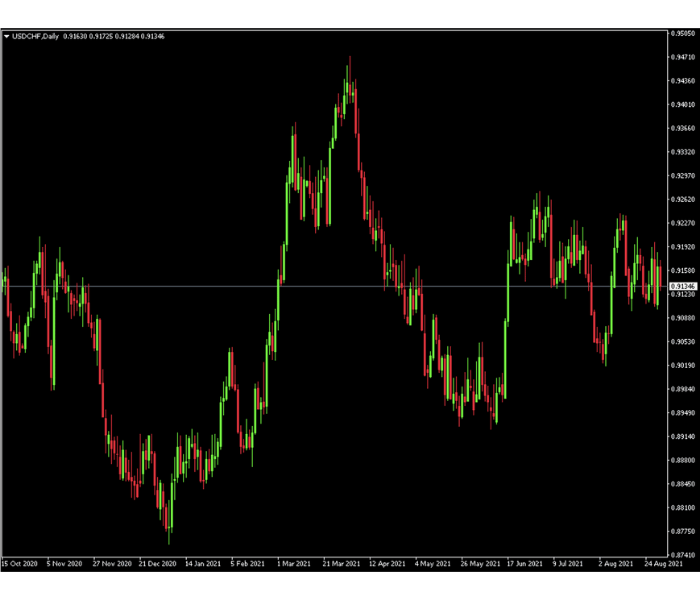
In addition to trading platforms like MT4, MT5, and others, traders can view and analyze Forex charts using third-party online charting tools like TradingView.
2. GUIDE TO READING 3 COMMON FOREX CHART TYPES
Forex charts can help traders identify patterns and determine support and resistance levels. Selecting the right timeframe is one of the most crucial aspects of reading Forex charts. While you can choose any timeframe you prefer, it’s recommended to use higher timeframes, such as weekly or monthly charts, when identifying overall trends.
To view historical data, scroll to the left of the chart. Below is a guide to reading the most common types of Forex charts used in trading.
2.1. Line Chart
This is considered the simplest and easiest-to-read type of chart. It can be a good starting point for new traders. However, it does not provide as much information as some other chart types. A line chart represents the closing prices over a specific period, meaning it only gives traders information about the closing prices.
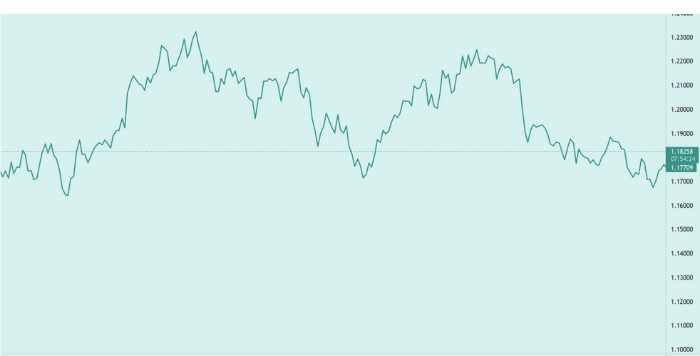
Because line charts offer a relatively simple view of exchange rate fluctuations, they can be used to identify overall trends and large-scale patterns on a chart. They provide traders with a general sense of how a currency pair has performed over a specific timeframe. For this reason, many Forex traders rely solely on line charts when assessing long-term trends.
A line chart also helps traders observe short-term trends that may impact a Forex currency pair. For example, you might notice a sharp decline due to a sell-off, followed by a recovery of the currency pair shortly afterward.
2.2. Bar Chart
Bar charts, also known as OHLC charts (Open, High, Low, Close), offer more information than line charts. They depict the highest price, lowest price, opening price, and closing price for each timeframe, with all these components forming a single bar.
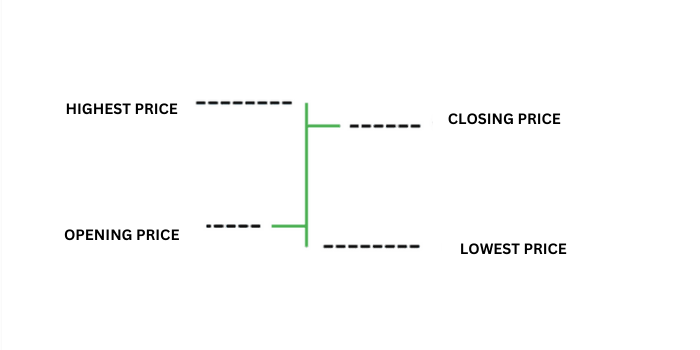
– The opening price is represented by a small dash on the left side of the vertical line.
– The small dash on the right side of the vertical line represents the closing price.
– The highest price is the topmost point of the vertical line.
– The lowest price is the bottommost point of the vertical line.
With the default chart settings, a green bar indicates a bullish bar. Conversely, a red bar indicates a bearish bar.
If the opening price on the left is higher than the closing price on the right, you have a bearish market during that period. Conversely, a higher closing price indicates a bullish market.
Note: The color of the bars can be customized by traders based on their preferences.
In each bar, the lowest point of the vertical line represents the lowest trading price for the specified currency pair within a given timeframe. Similarly, the highest point of the line shows the highest trading price within the same timeframe.
For example, in the H4 timeframe, the highest point represents the highest price traded over 4 hours.
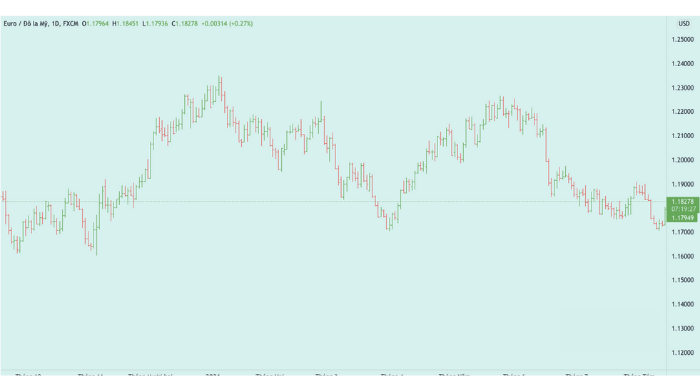
They can be useful in determining whether the market has closed above a key level in a chart pattern; this can signal a breakout. By looking at your entire bar chart, you can gain an overall understanding of the movement of the selected currency pair over a period. If your chart seems incomplete, you may adjust to a larger timeframe.
2.3. Candlestick Charts
A candlestick chart is simply a chart that consists of individual candles; traders use it to understand price action. The price action of a candlestick pattern involves identifying the opening and closing prices over a specific period, as well as the highest and lowest prices within a given timeframe.
Candlestick charts use a simple graphic resembling the body and wick of a candle. As a Japanese invention, this type of chart is sometimes referred to as a Japanese candlestick chart.
When reading a forex candlestick chart, it is crucial to understand the basic structure of a candlestick. Each candlestick represents a timeframe, which can range from one minute to a week, or even a month.
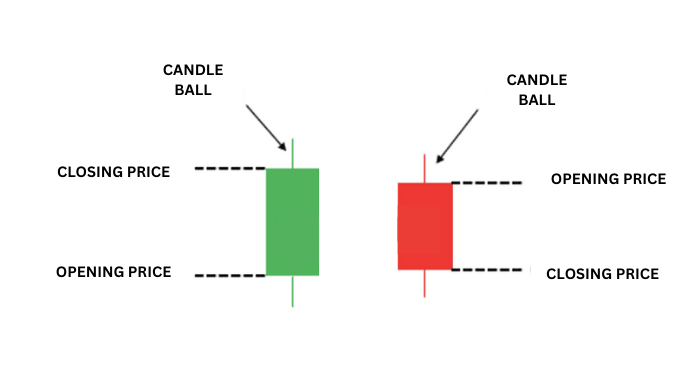
The relationship between the four price levels displayed by a candlestick can reveal a lot about how market conditions are forming and who is driving the price action: buyers or sellers.
Long green candlestick bodies may indicate significant buying pressure, while long red candlestick bodies may signify substantial selling pressure. On the other hand, candlesticks with long wicks but short bodies suggest notable pressure in one direction, but the price was pushed back before the period ended.
Once you know how to identify candlestick types, observe their relative positions on the chart. This helps you understand what the specific pattern is truly indicating about how the market is moving.
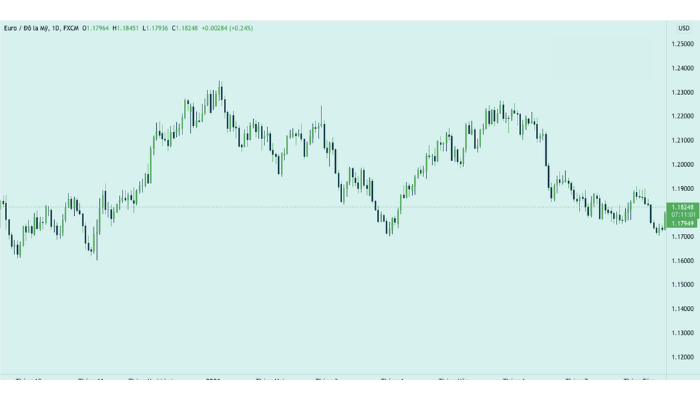
For example, suppose you see a Doji candlestick with one longer wick or no wick at all. If this candlestick appears at the top of an uptrend, it may signal that the uptrend is reversing because a Doji indicates market indecision.
3. SUMMARY
Learning to read popular forex charts can give you a significant advantage in trading, especially when you are new to forex. One of the best things you can do is spend some time understanding the information provided by charts, which can help gather historical data and learn how to use this data to predict what might happen next.
If you’re not yet confident in trading, you can practice trading and chart analysis on a demo account. Use chart data to analyze price action in the market. Trade live when you feel fully ready.
Wishing you smooth and successful trading!
- t.me/finance_solutes
- Website: https://finance-solutes.com
- Hotline: +1 929 5636 439 ( Hotline )
- 26 Broadway, Suite 934, New York, 10004, US
