
 XM
XM Bybit
Bybit Binance
 Robinhood
 Webull
 IC Markets
 Pepperstone
 OKX
OKX Vantage
 VT Markets
 BingX
BingX Gate.io
 Kucoin
 MEXC
MEXC Exness
 Bitget
A widely debated indicator that identifies strong trends, but often criticized for its complex interface, is the Ichimoku indicator. It was designed to be an independent indicator that displays the current trend. Despite its complex appearance, the nature of this indicator is much simpler than it seems.
The indicator in question here is Ichimoku. Many traders might wonder, what exactly is Ichimoku or the Ichimoku cloud, how to use Ichimoku, and what is the Ichimoku trading method, or how to apply Ichimoku techniques for catching tops and bottoms. Let’s take a closer look at the article below from Forex!
1. WHAT IS THE ICHIMOKU CLOUD?
The Ichimoku cloud indicator (Ichimoku Kinko Hyo), also known as the Ichimoku cloud, is a technical indicator. It’s called the Ichimoku cloud because it resembles the shape of a cloud. This indicator shows support and resistance levels, as well as momentum and trend direction.
It achieves this by calculating average values and plotting them on the chart. Additionally, it uses these data to calculate a “cloud” that predicts where the price might find future support and resistance levels. This versatility is why the Ichimoku cloud is considered a fairly complete trading system.
Ichimoku was developed by Goichi Hosoda, a Japanese journalist, along with a team of associates, starting in 1935. However, it wasn’t until the 1960s that he made this indicator public by incorporating it into a book and releasing it to the market.
2. COMPONENTS OF THE ICHIMOKU CLOUD AND HOW TO CALCULATE THE FULL ICHIMOKU
The Ichimoku cloud is famous for its complex and hard-to-understand interface, but once you understand it, you will find it much simpler than it appears.
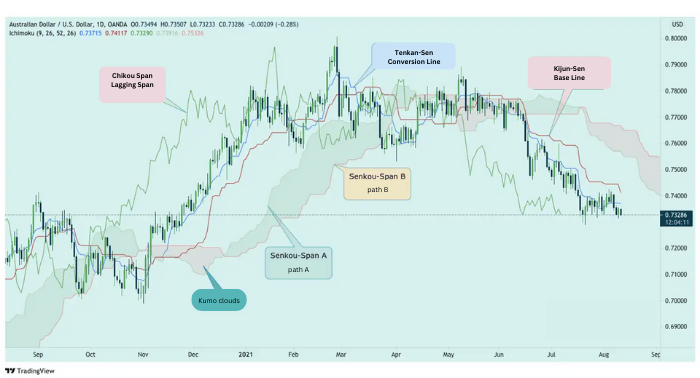
Ichimoku consists of five lines, and two of these five lines form a very special part of the indicator, which is the Kumo Cloud (the Kumo cloud).
Four out of the five components of the Ichimoku indicator are based on the average values of the highest and lowest prices over a specified period.
Before diving deeper into how to trade using Ichimoku, let’s take a closer look at its components and the formulas used to calculate this indicator below:
2.1. Kijun-Sen – The Base Line
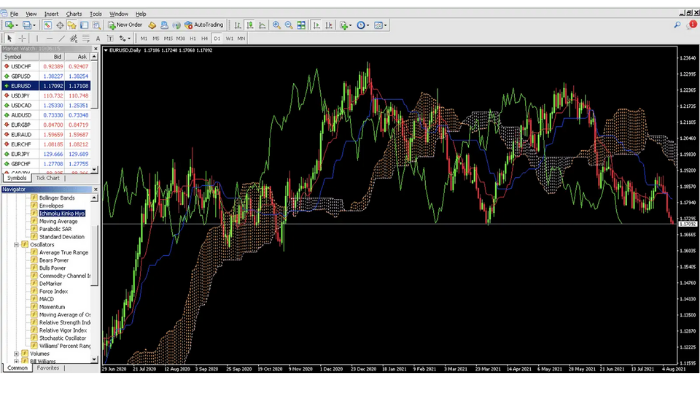
The Kijun-Sen, also known as the base line on the Ichimoku chart, is the red line shown above. Kijun-Sen acts as an indicator for future price movements. If the price moves above this line, it may continue to rise. Conversely, if the price moves below this line, it could potentially fall further.
Typically, Kijun-Sen is the average of the highest high and lowest low over the past 26 periods. For a D1 timeframe, this would be 26 days.
Formula for calculating Kijun-Sen:

2.2. Tenkan-Sen (Conversion Line) – The Conversion Line
In the chart above, the Tenkan-Sen is the blue line. The Tenkan-Sen, also known as the conversion line, serves as an indicator of the market’s trend. If this line is moving up or down, it indicates the market is trending. If the line is flat, it suggests the market is ranging.
In other words, if the price is above the Tenkan-Sen, the market is in an uptrend. Conversely, if the price is below the Tenkan-Sen, the market is in a downtrend.
The calculation of the Tenkan-Sen is similar to that of the Kijun-Sen but is based on a 9-period range instead of 26 periods.
Formula for calculating Tenkan-Sen:

2.3. Chikou Span – The Lagging Span
Chikou Span, also known as the lagging span, is the green line on the chart. It is called the lagging span because it represents the current closing price plotted 26 periods back.
When the Chikou Span crosses the price line from above to below, it is a signal to sell. Conversely, when the Chikou Span crosses the price line from below to above, it is a signal to buy.
2.4. Senkou Span A: Leading Span A
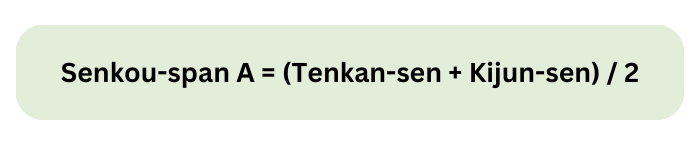
Leading Span A (Senkou Span A) is the lighter green line above the chart. It is the average of the Tenkan-Sen and Kijun-Sen, and it is plotted 26 periods ahead of the current price.
Formula for calculating Senkou Span A:
2.5. Senkou Span B: Leading Span B
Senkou Span B (Leading Span B) is the orange line in the chart above. The formula for calculating Senkou Span B is similar to the formulas for Tenkan-Sen and Kijun-Sen, except that it is calculated over 52 periods instead of 26. Like the other leading spans, it is plotted 26 periods ahead of the current price.

2.6. Kumo: Ichimoku Cloud
The Kumo Cloud is the most distinctive and notable feature of this indicator and is often used to confirm the overall trend. This cloud is formed by the two lines, Senkou Span A and Senkou Span B.
Since the Kijun-Sen and Tenkan-Sen are calculated over 26 and 9 periods respectively, while the Senkou Span B is calculated over 52 periods, the lighter green line (Senkou Span A) will move faster than the orange line (Senkou Span B). This principle is also applied to moving averages: shorter period moving averages are harder to predict and move faster compared to longer period moving averages.
There are two main ways to determine the overall trend using Ichimoku. First, the trend is considered bullish when the price is above the cloud, bearish when the price is below the cloud, and sideways when the price is within the cloud.
Secondly, a strong uptrend occurs when the Senkou Span A line is sloping upwards and is above the Senkou Span B line. This creates a green cloud. Conversely, a strong downtrend is confirmed when the Senkou Span A line is sloping downwards and is below the Senkou Span B line, resulting in a red cloud.
Because the cloud is plotted 26 periods ahead, it also provides an overview of potential future support or resistance.
3. HOW TO SET UP ICHIMOKU IN MT4
The Ichimoku indicator is integrated into most trading platforms. Since MT4 is the most popular trading platform, this forex tutorial will guide you on how to use Ichimoku on MT4. Setting up this indicator is simple and can be done in various ways.
Method 1: Open via the Navigator Panel
– Open the MT4 software.
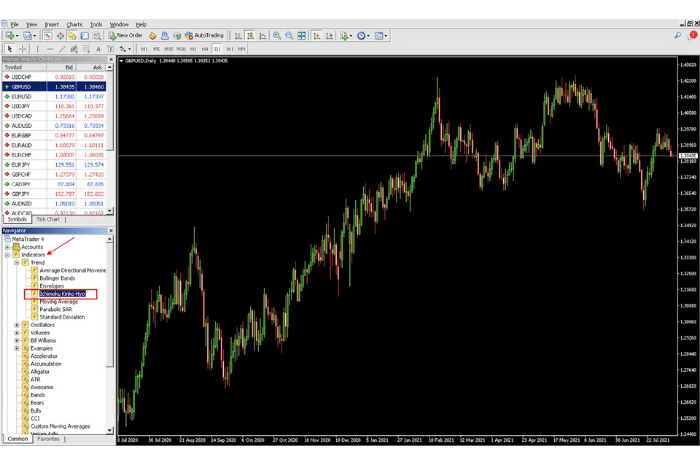
– Look at the Navigator panel on the left side of the screen -> Choose Indicators -> Trend -> Select Ichimoku Kinko Hyo.
– After that, a settings dialog will appear:
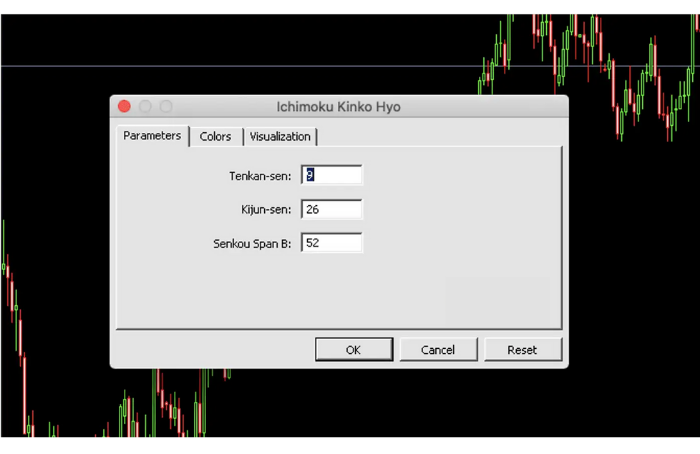
In this dialog box, you can adjust the period settings for the components of the Ichimoku indicator. The default settings are displayed in this box, and while you can customize them, Forex recommends using the default settings. Additionally, you can change the colors in the Colors tab.
Note: In the Colors tab, Up Kumo and Down Kumo refer to Senkou Span A and Senkou Span B respectively.
– After clicking OK, your chart will look like this:
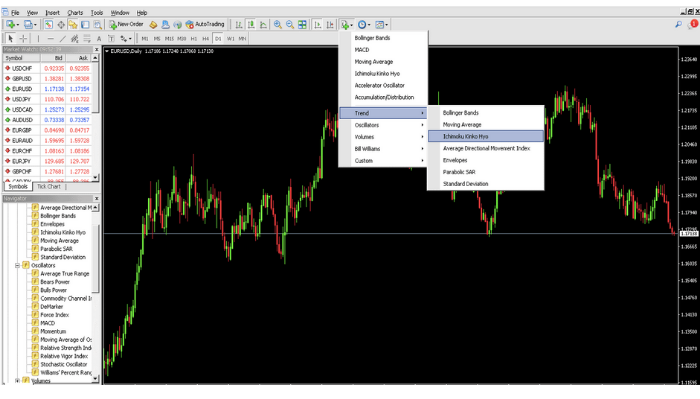
Method 2: Open via the Menu Bar
– Open the MT4 software.
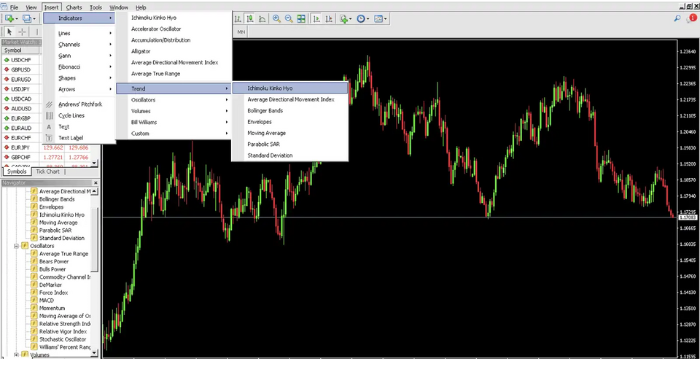
– Look at the Menu Bar, then go to Indicator List (see the image) -> Trend -> Select Ichimoku Kinko Hyo.
– Once the Ichimoku settings dialog box appears, follow the same steps as in Method 1.

- t.me/finance_solutes
- Website: https://finance-solutes.com
- Hotline: +1 929 5636 439 ( Hotline )
- 26 Broadway, Suite 934, New York, 10004, US
