
 XM
XM Bybit
Bybit Binance
 Robinhood
 Webull
 IC Markets
 Pepperstone
 OKX
OKX Vantage
 VT Markets
 BingX
BingX Gate.io
 Kucoin
 MEXC
MEXC Exness
 Bitget
The flag pattern in forex is a popular pattern that traders should consider using when performing technical analysis. This article will help you identify trading opportunities with the flag pattern.
1. BULLISH FLAG PATTERN
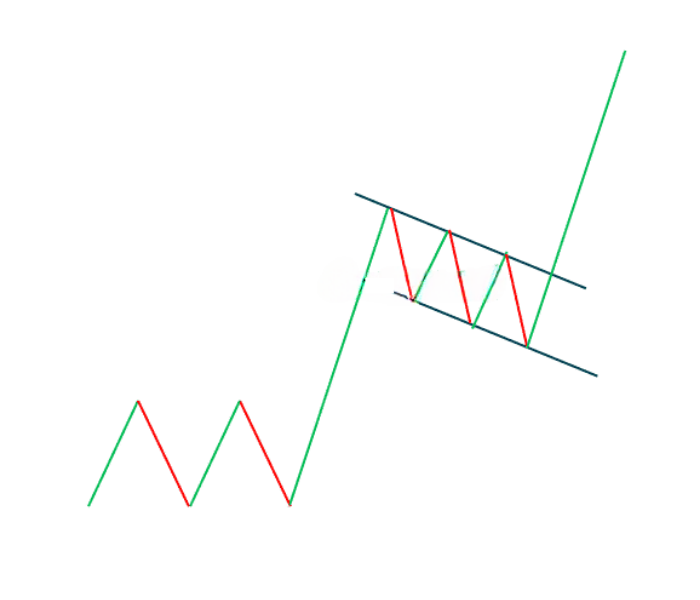
The bullish flag pattern is a continuation pattern that forms as a brief pause in an uptrend after a strong price increase. The bullish flag pattern resembles a downward-sloping rectangle, represented by two parallel trendlines moving in the opposite direction of the prior trend.
In this consolidation zone, trading volume gradually decreases during the formation and then increases sharply, indicating strong momentum to push the price higher. Once completed, the pattern will resemble a flagpole, which is why it’s called the bullish flag pattern.
1.1. How to Identify the Bullish Flag Pattern on a Chart
Identifying this pattern can be a bit complex because it consists of several smaller components. Traders need to accurately identify and understand these components to successfully trade the pattern. Key points to pay attention to when trading the bullish flag pattern are:
- The prior uptrend (flagpole)
- Identifying the downward-sloping consolidation zone (bullish flag)
- If the retracement goes deeper than 50%, it may not be a flag pattern. Ideally, the retracement should end at a level below 38% of the initial trend.
- Enter the trade at the bottom of the consolidation zone or the breakout point at the upper boundary of the consolidation.
- Set the take-profit point at a distance equal to the length of the flagpole from the consolidation zone.
1.2. Bullish Flag Trading Strategy
The following trading example shows the bullish flag pattern on a forex chart.
The bullish flag pattern appears on the AUD/CAD pair chart:
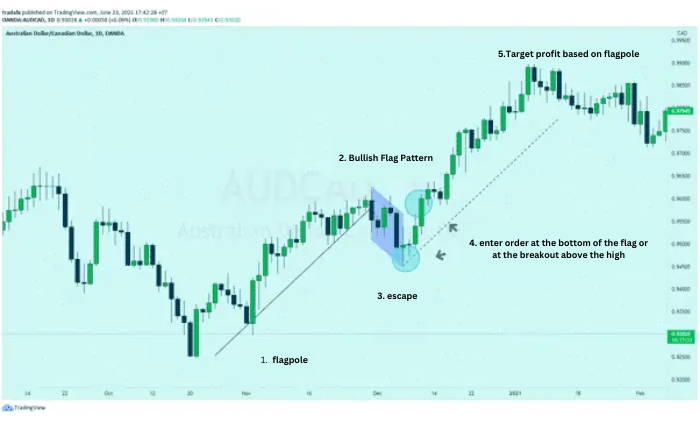
As shown by the bullish flag pattern above, traders have bought risk through commodities, the stock market, and currencies based on risk. As a result, the AUD has performed well against most other currencies, partly because it offers higher yields due to its interest rates. Therefore, traders have a fundamental backdrop to support the technical picture, further strengthening the AUD.
AUD/CAD is no stranger to the flag pattern. The prior uptrend (flagpole) is marked by the black trendline. Price consolidates within a gently downward-sloping zone (blue). To trade the flag pattern in this case, traders can enter at the bottom of the consolidation zone, or if more confident, wait for the price to break out at the upper boundary of the consolidation zone (yellow). Traders would then look to take profit by measuring the length of the flagpole before the flag (black dashed line).
The reliability of the bullish flag pattern depends on how successful the forming elements are, as mentioned above. When all the components of the bullish flag are identified and present on the chart, the pattern is considered a reliable one to trade.
1.3. Advantages and Disadvantages of the Bullish Flag Pattern
| Advantages |
|
| Disadvantages |
|
2. BEARISH FLAG PATTERN
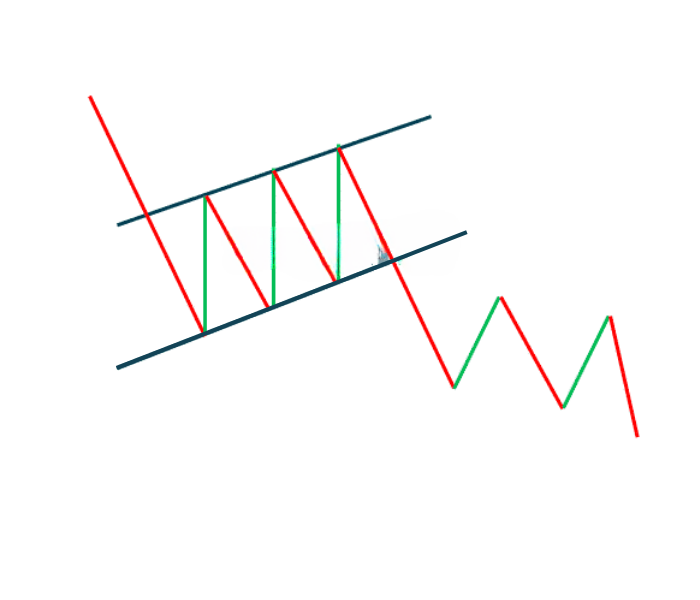
The bearish flag pattern is a technical pattern that offers an extension or continuation of an existing downtrend. The formation of the bearish flag pattern begins with a strong downward move, followed by a consolidation zone that moves upward (see image below). The strong downward move is referred to as the “flagpole,” while the consolidation zone is the “flag” portion.
2.1. How to Identify the Bearish Flag Pattern on a Chart
The bearish flag pattern can be easily identified when traders have a thorough understanding of the components that make up the pattern, and this can be applied to all financial markets, not just forex. The pattern itself is divided into three parts:
- Traders will first need to identify the flagpole, which is the initial downward move. This decline can be steep or gradual; this sets the foundation for the trend.
- The bearish flag pattern is defined by the consolidation period that follows the initial downward move. During this phase, the price may gradually rise and retrace part of the initial move. At this point, traders will wait for the price to break out to the downside, continuing the trend.
- After the price starts to decline again, traders can then find the final component needed to trade the bearish flag pattern. The take-profit level is the potential value to capture profits after the next downward move of the currency pair. This value can be determined by measuring the pip distance of the initial drop. This value can then be subtracted from the resistance level formed by the consolidation zone.
2.2. Summary of the Bearish Flag Pattern Formation
Step 1: Confirm a prior downtrend (flagpole)
Step 2: Identify the upward-sloping consolidation zone (bearish flag pattern)
Step 3: If the retracement forms above 50%, it may not be a flag pattern. The ideal retracement level is below 38%.
Step 4: Enter the trade at the start of the flag or upon breaking the lower boundary of the consolidation zone.
Step 5: Set the target price lower by a distance equal to the length of the flagpole.
2.3. Bear Flag Trading Strategy
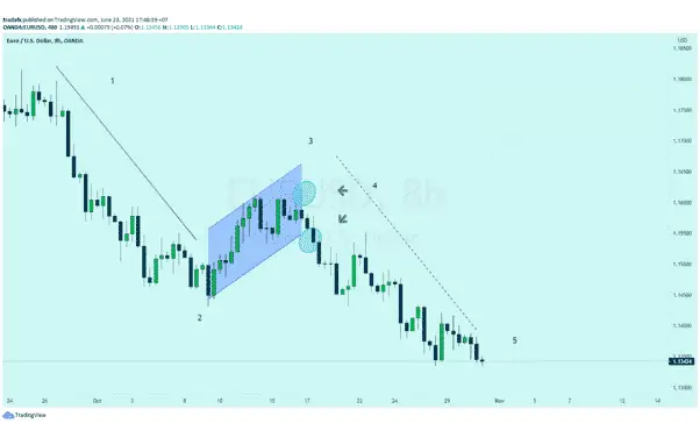
Here is an example of how to trade a bear flag pattern using a Forex chart.
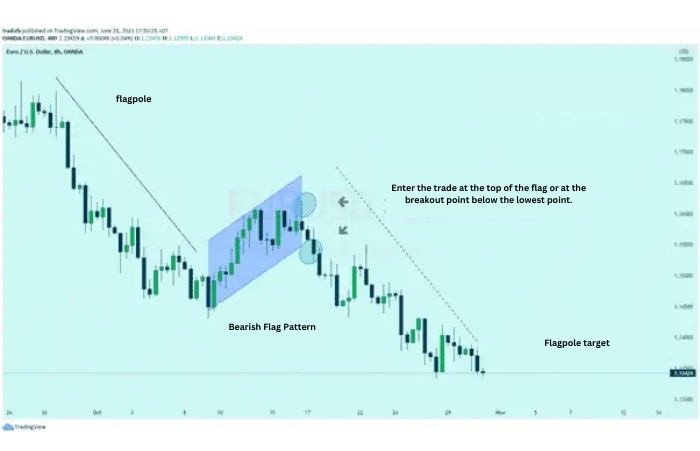
The chart above shows the bear flag pattern forming on the daily EUR/USD chart. The flagpole has been set by connecting the highest peak at 1.18000 to the lowest trough at 1.14300. The distance between the peak and trough is 370 pips. The accumulation phase of the move is marked by the green area.
As the price gradually rises, the flag pattern slowly forms. It is important to note that no bear flag pattern is established until the price breaks down to the lowest point of the accumulation area. At that point, traders use the initial 370-pip low to set a potential take-profit target near the price level of 1.1060.
In the above example, although the price did not fully reach this level, this is how traders typically orient themselves when trading this pattern. Traders need to be aware of price volatility and other fundamental and technical moves that may occur during the trade.
The bear flag pattern is considered an extremely reliable price pattern when all the formation characteristics are followed.
2.4. Advantages and Disadvantages of the Bear Flag Pattern
| Advantages |
|
| Disadvantages |
|
3. COMPARISON OF BULLISH/BEARISH FLAG PATTERNS
The bullish and bearish flag patterns share relatively similar characteristics but signal opposite market directions.
- The bear flag pattern appears in a downtrend, while the bull flag pattern appears in an uptrend.
- The bear flag pattern breaks out from the accumulation area when the price breaks below the lower boundary.
- Both the bear flag and bull flag patterns measure the price target as a projection using the length of the flagpole.
We hope that the forex knowledge provided above helps you better understand the details of the bullish/bearish flag pattern. Wishing you successful trades!
- t.me/finance_solutes
- Website: https://finance-solutes.com
- Hotline: +1 929 5636 439 ( Hotline )
- 26 Broadway, Suite 934, New York, 10004, US
