
 XM
XM Bybit
Bybit Binance
 Robinhood
 Webull
 IC Markets
 Pepperstone
 OKX
OKX Vantage
 VT Markets
 BingX
BingX Gate.io
 Kucoin
 MEXC
MEXC Exness
 Bitget
The Triple Top and Triple Bottom patterns are among the most basic reversal patterns in price action. Although they don’t appear as frequently on forex charts as the Double Top and Double Bottom patterns, when they do form, they often signal an even higher probability of a trend reversal. So, what exactly are the Triple Top and Triple Bottom patterns? And how can you trade using them effectively? Let’s explore in this article with Forex.
1. TRIPLE TOP PATTERN
The Triple Top is one of the most popular reversal patterns in forex trading. While it is a classic price pattern, whenever it appears, the probability of a trend reversal is even higher than with other patterns.
1.1. What is the Triple Top Pattern?
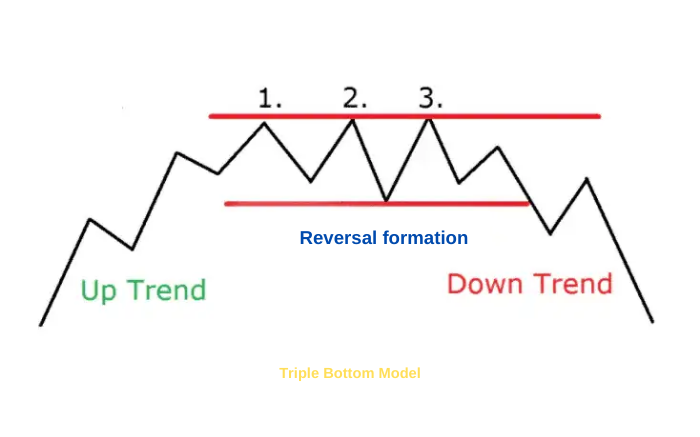
The Triple Top pattern, as the name suggests, is formed by three peaks. It is a type of reversal pattern that appears at the end of an uptrend. When it forms, it signals a reversal from an uptrend to a downtrend.
1.2. Characteristics of the Triple Top Pattern
The Triple Top pattern is considered a variation of the Double Top pattern, as after the formation of the first peak, the second peak is created (similar to the Double Top pattern). However, the price fails to break through the neckline and continues to rise, forming the third peak.
If the third peak is formed at a height equal to the first and second peaks, the likelihood of the Triple Top pattern being formed is high.
Like the Double Top pattern, the Triple Top pattern has a simple structure, consisting of:
- 3 peaks
- Neckline
- Previous uptrend
When the pattern appears at the end of an uptrend, it indicates that buying pressure has decreased, as evidenced by the formation of peak 1 and peak 2. However, since the price fails to break through the neckline, the forces of supply and demand are temporarily in balance.
Thus, when the selling pressure pushes the price down, the buying pressure continues to push the price up, creating the third peak. This phase can be considered an accumulation period. In this case, the Triple Top pattern appears at the end of the uptrend, suggesting that sellers are attempting to dominate the market. After breaking through the neckline, the price begins to form lower lows—marking the transition from an uptrend to a downtrend.
1.3. Ascending Triple Top and Descending Triple Top Patterns
1.3.1. Ascending Triple Top (Three Rising Peaks)
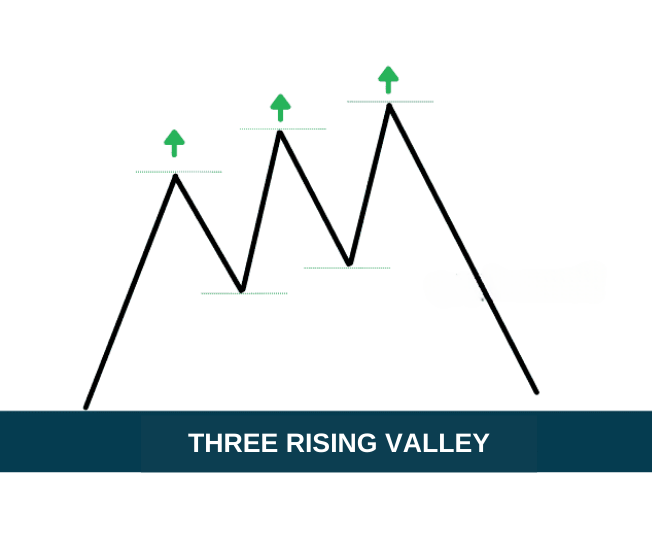
This is a variation of the Triple Top pattern, but with the distinctive feature of the trend creating higher peaks and higher lows. You can observe the chart below to better understand this pattern:
1.3.2. Descending Triple Top (Three Falling Peaks)
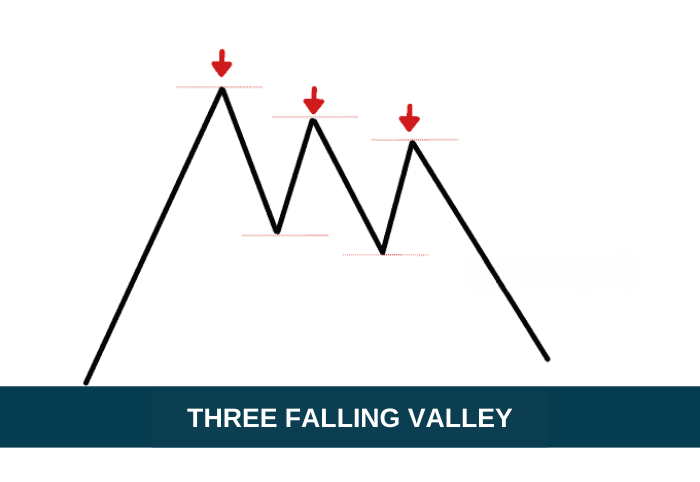
In contrast to the Ascending Triple Top, the Descending Triple Top is also a variation of the Triple Top pattern, but with the distinct feature of the trend creating lower peaks and lower lows. This pattern typically appears after an uptrend, signaling that the market may continue to decline further.
1.4. Trading with the Triple Top Pattern
To ensure profitability, traders should wait until the Triple Top pattern is fully formed. Afterward, you can use the following trading strategy:
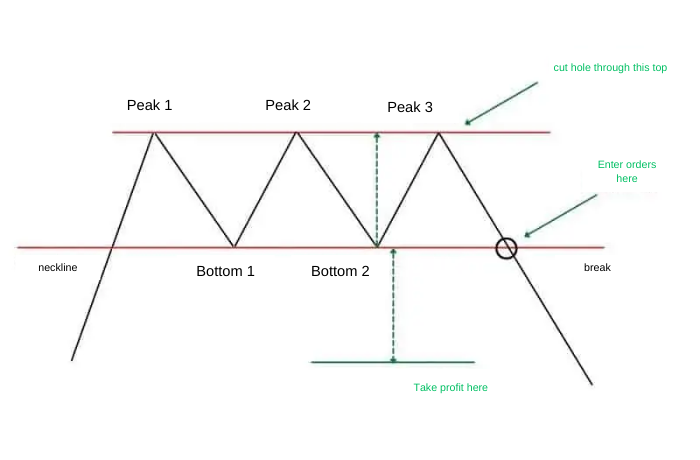
Method 1: Enter a trade when the price breaks the Neckline – signaling the official completion of the Triple Top pattern.
- Once the price turns downward and breaks through the neckline, you can enter a SELL trade immediately. For traders who don’t have time to monitor the chart constantly, you can use a Pending Sell Stop order to trade. This way, the order will be automatically executed when the price touches the breakout point.
- Place the Stop Loss order at the third peak, and you can set it slightly above the wick of the candle to avoid being stopped out.
- Set the Take Profit order below the support level, at a distance equal to the height of the pattern (from the bottom to the peak).
Method 2: Enter a trade after the price breaks and retests the Neckline
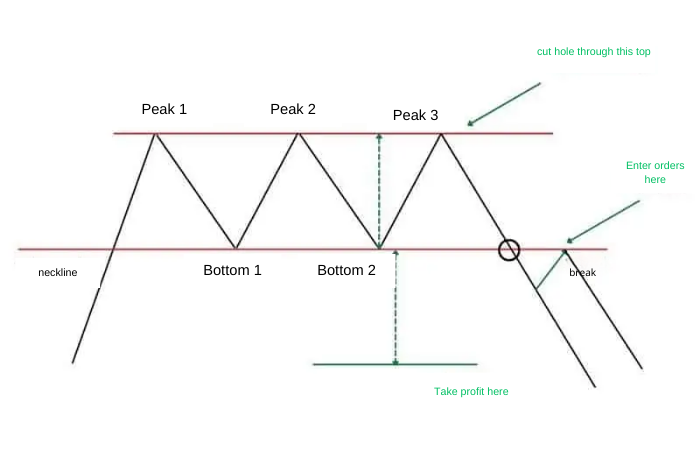
- When the price breaks the Neckline, this support level turns into a resistance level. The price is likely to return to retest this level before continuing to decrease. The entry point in this case is when the price retests the neckline.
- The Stop Loss and Take Profit orders can be set as illustrated in the image below:
And here is a real example of the triple top pattern on a forex chart:

Real example of the 3-peak stock model on the VNINDEX index chart:
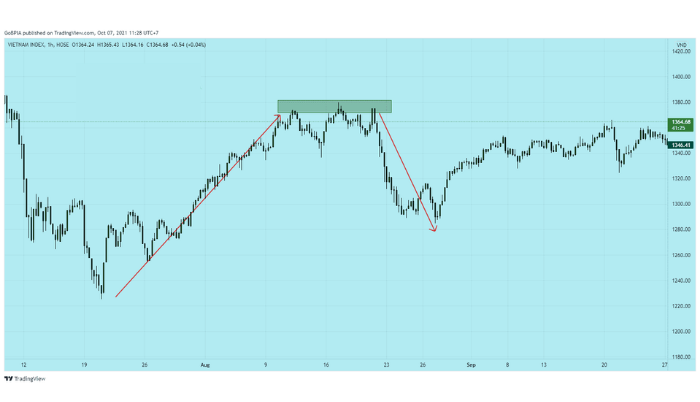
This is a pattern that doesn’t appear frequently on forex charts. When this pattern forms, you can trade using one of the two methods that Forex has shared. If you are a cautious trader, the best time to enter a trade is when the price retests the Neckline.
2. TRIPLE BOTTOM PATTERN
The Triple Bottom pattern (also known as the Triple Bottom) is a forex price pattern that identifies a market trend reversal. It consists of three bottoms shaped like three “V” formations, accompanied by two peaks forming an “A” shape, with a breakout point above the resistance level.
2.1. What is the Triple Bottom Pattern?
In essence, the Triple Bottom pattern and the Triple Top pattern can be considered opposites. The Triple Bottom is the reverse of the Triple Top.
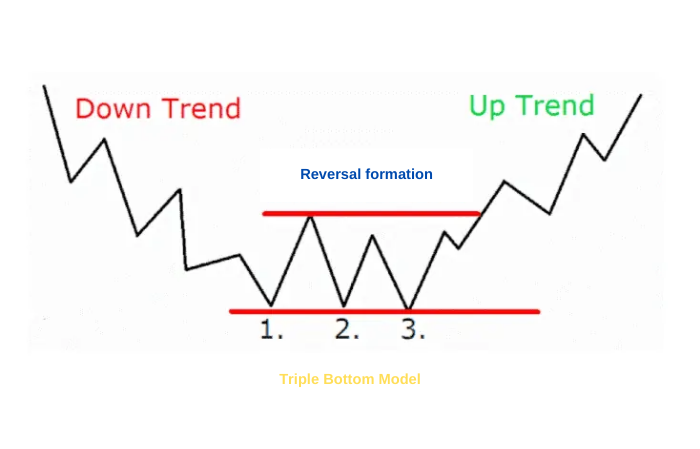
The Triple Bottom pattern forms at the end of a downtrend. When it appears, it signals a reversal from a downtrend to an uptrend.
2.2. Characteristics of the Triple Bottom Pattern
This pattern is considered a variation of the Double Bottom pattern. After the formation of the first bottom, the second bottom (similar to the Double Bottom pattern) forms. However, the price fails to break through the neckline and continues to decline, forming the third bottom.
If the third bottom is formed at a height equal to the first and second bottoms, the likelihood of the Triple Bottom pattern being formed is high.
Like the Double Bottom pattern, the Triple Bottom pattern has a simple structure, consisting of:
- 3 bottoms
- Neckline
- Previous downtrend
When the pattern appears at the end of a downtrend, it indicates that selling pressure has decreased, as shown by the formation of the first and second bottoms. Since the price fails to break through the neckline, the forces of supply and demand are temporarily in balance.
2.3. Ascending and Descending Triple Bottom Patterns
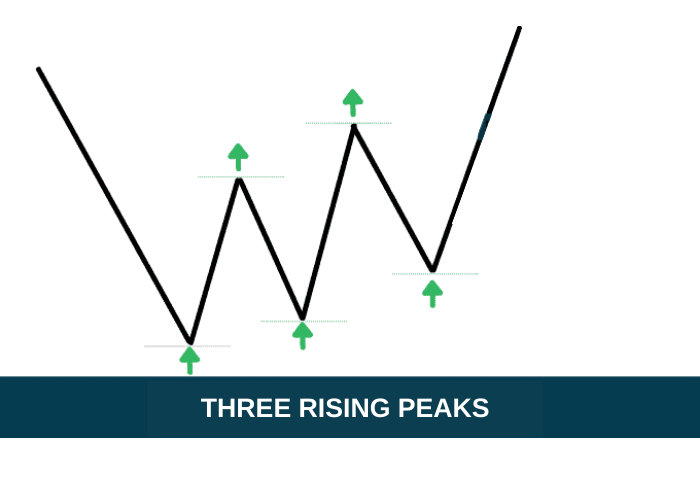
Ascending Triple Bottom (Three Rising Valleys)
The Ascending Triple Bottom signals that the market may rise further and typically forms after a downtrend. This pattern consists of three bottoms arranged from low to high, with the bottoms being of similar width. You can observe this pattern more clearly in the chart below:
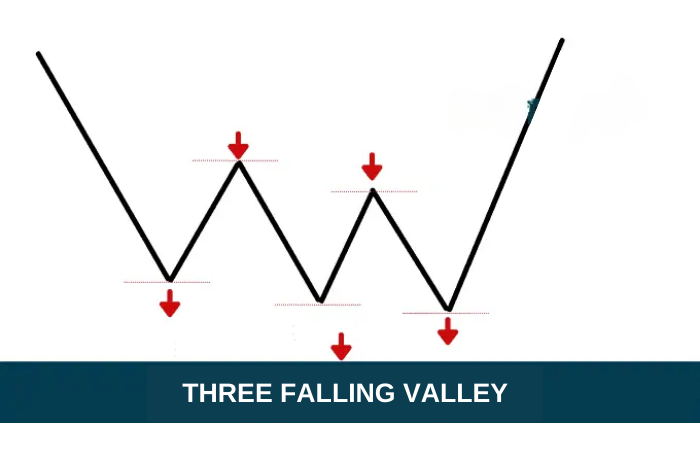
Descending Triple Bottom (Three Falling Valleys)
In contrast to the Ascending Triple Bottom, the Descending Triple Bottom is also a variation of the Triple Bottom pattern but with the distinct feature of the trend creating lower bottoms and lower peaks. This pattern suggests that the market may face a prolonged downtrend before a potential reversal.
2.4. Trading with the Triple Bottom Pattern
Although it does not appear as frequently as the Double Bottom pattern, the Triple Bottom is still considered a high-probability pattern. Trading this pattern is similar to trading the Triple Top pattern. You can execute trades using either of the following methods:
Method 1: Enter a trade as soon as the Triple Bottom pattern is formed
Once the price reverses upward and breaks the Neckline, you can enter a trade immediately. Typically, after confirming the neckline, you can place a Pending Buy Limit order to execute the trade.
Method 2: Enter a trade when the price returns to retest the Neckline
Similar to trading the Triple Top pattern, when the price breaks through the neckline, it often retests this level. When you see signs of the price turning upward, you can enter a trade and set your Stop Loss and Take Profit levels as illustrated below:
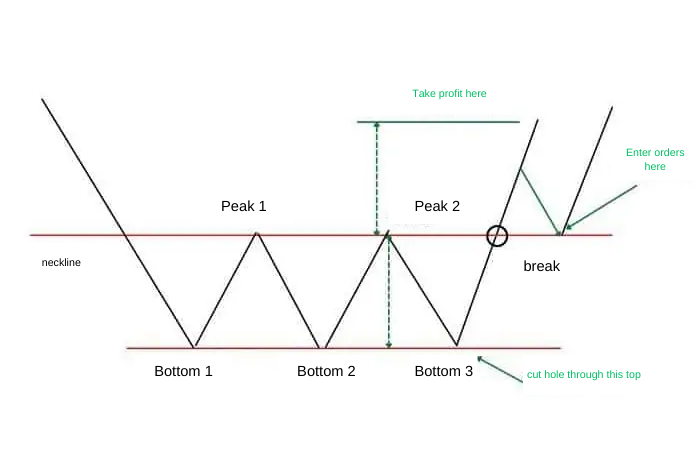
- Enter the order at the price point that retests the Neckline as shown in the picture
- Set the Stop Loss just below the third bottom.
- Place the Take Profit above the Neckline, at a distance equal to the height from the bottom to the peak of the pattern.
And here is the actual image of the Triple Bottom pattern on the forex chart:
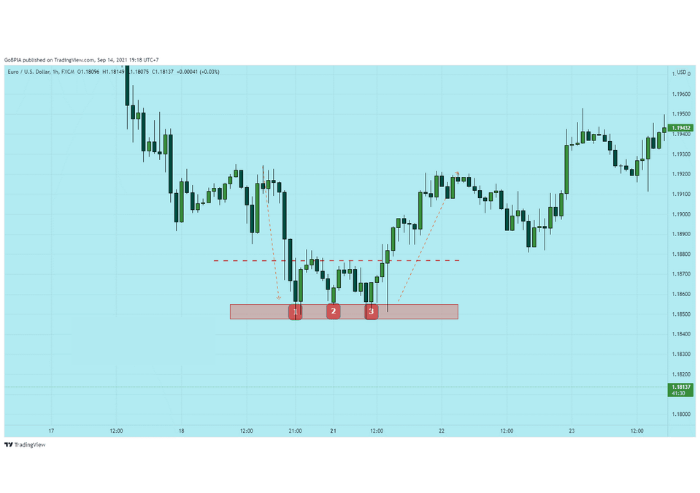
Actual image of the 3-bottom model in stocks on the VNINDEX index chart:
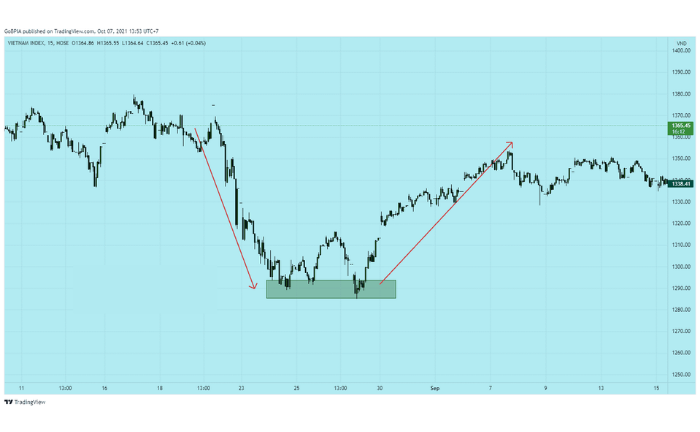
If trading using Method 2, traders can potentially earn higher profits than Method 1. However, they also risk missing the entry opportunity if the price does not return to retest the neckline.
3. SUMMARY
Through today’s article, Forex has provided you with comprehensive knowledge to answer all your questions about the Triple Top and Triple Bottom patterns. We hope that what we have shared will help you in your forex trading and investment process, and offer a deeper understanding of price patterns.
Wishing you successful trading!
- t.me/finance_solutes
- Website: https://finance-solutes.com
- Hotline: +1 929 5636 439 ( Hotline )
- 26 Broadway, Suite 934, New York, 10004, US
