
 XM
XM Bybit
Bybit Binance
 Robinhood
 Webull
 IC Markets
 Pepperstone
 OKX
OKX Vantage
 VT Markets
 BingX
BingX Gate.io
 Kucoin
 MEXC
MEXC Exness
 Bitget
Breakout trades in general can offer a more attractive potential risk:reward ratio, allowing traders to keep tighter stop-loss points relative to potential profit points. One effective way to do this is by trading the Rectangle pattern.
This pattern appears when the price consolidates between an identified support and resistance zone. Traders will wait for the price to accumulate within this range before it makes its next significant move. Let’s dive deeper into this pattern with Forex in this forex knowledge series.
1. WHAT IS THE RECTANGLE PATTERN?
The Rectangle pattern represents a pause in the trend, where the price moves sideways between parallel support and resistance levels. This pattern typically reflects price accumulation before continuing in the original direction of the current trend.
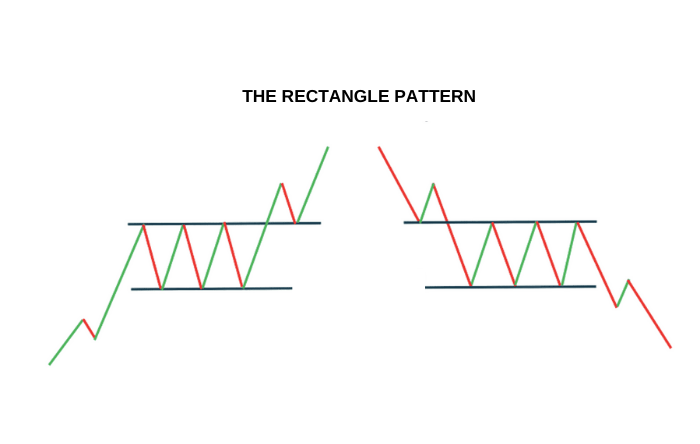
A confirmation candle closing outside the upper or lower boundary indicates the end of the Rectangle pattern and signals a breakout to continue the initial trend. Traders must always be aware of the possibility of trend reversal by analyzing the overall chart—this chart can illustrate broader patterns.
This pattern can be found in both an uptrend and a downtrend. The image below shows two scenarios representing the bullish and bearish Rectangle patterns.
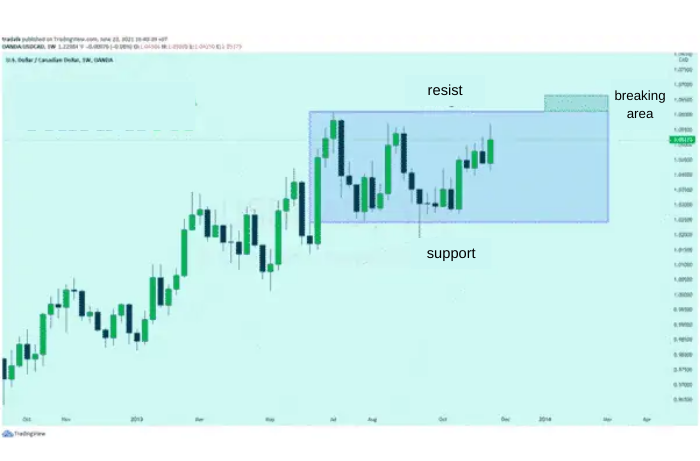
1.1. Bullish Rectangle Pattern
A continuation pattern that occurs in an uptrend, where traders should look for buy positions when the price breaks through the resistance level and closes within the “breakout zone.”
1.2. Bearish Rectangle Pattern
A continuation pattern that occurs in a downtrend, where traders should look for sell positions when the price breaks through the support level and closes within the “breakout zone.”
2. ADVANTAGES OF USING THE RECTANGLE PATTERN FOR BREAKOUT TRADING
There are several reasons why the Rectangle pattern is a popular choice for traders when it comes to breakout strategies:
- Easy to identify support and resistance levels in the rectangle pattern.
- Can be applied in various markets.
- The concept is simple to understand for beginner traders – recognizing an accumulation pattern in an existing trend and then trading the breakout.
- Entry points, stop-loss levels, and take-profit targets are easily identifiable and executable in trading.
- Used in breakout trading strategies or zone-based trading strategies.
Ultimately, a breakout leads to price moving past a well-established support or resistance level, with the Rectangle pattern forming these barrier channels. This means the pattern is directly linked to breakout trading opportunities.
3. TOP BREAKOUT TRADING TIPS WITH THE RECTANGLE PATTERN
Breakout trading with the Rectangle pattern in forex is relatively simple. The following steps summarize what you should do when entering a trade:
- Identify the prior trend.
- Ensure no long-term/macroeconomic patterns are active before conducting your pattern analysis.
- Set support and resistance levels by combining the peaks and troughs in the ‘rectangle’ pattern.
- Wait for a breakout in the direction of the original trend with a candle closing either below the support or above the resistance level, depending on the trend’s direction – enter the trade when the candle closes.
- By measuring the height of the rectangle and projecting that height above the resistance or below the support, traders can set a target price for the breakout.
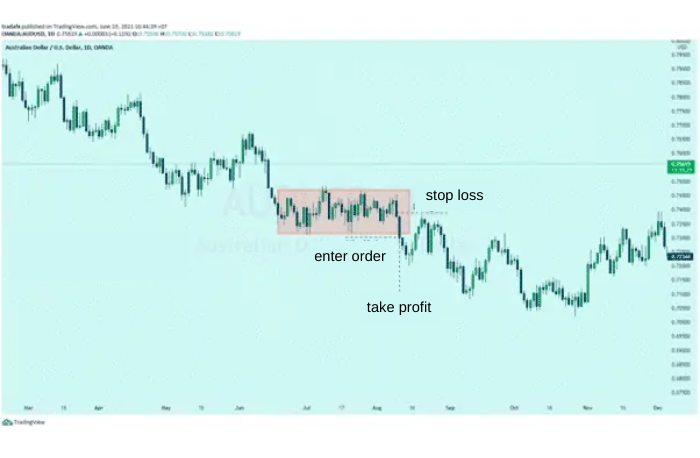
The chart below provides a real example using the AUD/USD currency pair with this simple yet effective Rectangle pattern:
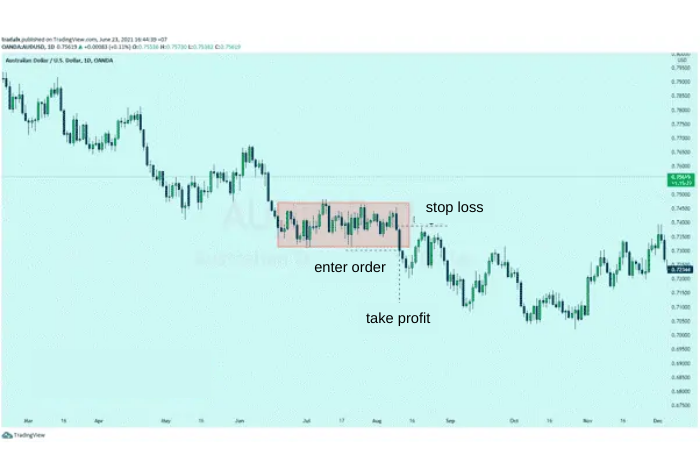
This illustrates the formation of a Rectangle pattern in a previous downtrend, marked by the blue trendline confirming the progressively lower peaks and troughs. The rectangle gradually forms as price moves sideways. This sideways movement creates a boundary zone within the support and resistance range (the red rectangle).
When the Rectangle pattern is identified, the entry point is marked by a closing candle that breaks the support level, and the price continues to move down. This is the opposite for a bullish rectangle pattern, where traders will look to enter the trade above the resistance level when the candle closes. The take-profit level is set by extending the height of the rectangle downward, while the stop-loss is placed at the highest point of the breakout candle, resulting in a risk-to-reward ratio of 1:2.
4. SUMMARY
In this article, Forex has introduced the concept of the Rectangle pattern, how to identify it on a forex chart, and effective trading methods for this popular pattern. We hope the knowledge we’ve shared will assist you in your forex trading and investment journey.
Wishing you success in your trading career!
- t.me/finance_solutes
- Website: https://finance-solutes.com
- Hotline: +1 929 5636 439 ( Hotline )
- 26 Broadway, Suite 934, New York, 10004, US
