
 XM
XM Bybit
Bybit Binance
 Robinhood
 Webull
 IC Markets
 Pepperstone
 OKX
OKX Vantage
 VT Markets
 BingX
BingX Gate.io
 Kucoin
 MEXC
MEXC Exness
 Bitget
Have you heard of Time Frame? This is a basic technical term for anyone starting to explore the market, price trends, and buying and selling transactions on online trading platforms. So, what is Time Frame? How to determine the most specific and accurate Time Frame? What should you pay attention to when trading within Time Frame? Let’s explore these questions with Forex.
What is Time Frame?
Definition of Time Frame
Time Frame, also known as the Time Frame, refers to the period of fluctuation of a candlestick during a specific trading session. You can simply understand it as a time period during which candlesticks are formed to forecast the market and price trends. After this trading session ends, a new candlestick is formed with a new time frame, forecasting a new trend. The time during which the candlestick fluctuates in the market is called the Time Frame.
For example, if you choose to trade in a 1-hour time frame (H1), a fixed candlestick on the chart will specifically show the price fluctuations of the market up and down within 1 hour. Therefore, after this default time period ends, a new candlestick will appear. Similarly, if you choose a time frame of 1 day (D1), after 1 day, the chart will display a new candlestick representing the market’s price for that day.
The Importance of Time Frame in Forex Trading
Time Frame is extremely important in trading as it helps traders and investors determine the price fluctuations and market movement during a specific period they want to monitor. It will allow them to predict the opening price, closing price, highest and lowest points, resistance and support zones, etc.

In addition, traders and investors, besides identifying the price fluctuation range in a specific Time Frame, can also determine the degree of price volatility within a certain cycle using the Time Frame. For example, if you use the H1 time frame, you will have cycles distributed across different time periods such as 9 hours, 12 hours, or 24 hours… or if you choose the D1 time frame, the cycles will be divided into 7 days, 14 days, 20 days, or 52 days…
Popular timeframes
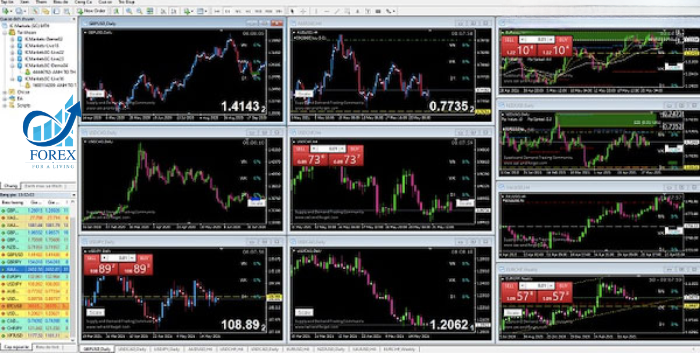
Currently, there are many Time Frame options that traders and investors can choose from to suit their trading strategies. Additionally, the MT4 software provides a wide range of integrated Time Frame options that are widely used by traders. You can refer to these Time Frames to select the one that fits best, such as M1, M5, M15, M30, H1, H4, D1, W1, and MN. The meanings of these abbreviations are as follows:
- M stands for Minute.
- H stands for Hour.
- D stands for Day.
- W stands for Week.
- MN stands for Month.
Tips for Choosing the Right Time Frame for Each Technical Analysis
The basic principle, which is also the core principle of Time Frame, is the principle of time reversal and volatility. Specifically, it is: Large volatility, small Time Frame; and conversely, small volatility, large Time Frame. You can understand it this way: if the price fluctuations and trends are small, the Time Frame will be a longer period to carry out technical analysis. However, if the price fluctuations and trends are large, the Time Frame will be much shorter to complete the technical analysis.

Now, let’s analyze the two principles above:
When to Perform Technical Analysis on Smaller Time Frames like M5 and M15
Technical analysis should be conducted on Time Frames like M5 and M15 when the market experiences large and extreme volatility. During these times, the fluctuations on M5 and M15 can correspond to price movements ranging from 50-200 pips. Therefore, it is necessary to choose a smaller Time Frame for analysis.
If you were to choose a larger Time Frame in this case, the total fluctuations within that Time Frame would be smaller and might only represent a single fluctuation in a larger Time Frame. This could cause you to miss out on new trends.
Moreover, when the market is volatile and changing rapidly, there will be a series of price patterns and candlestick patterns appearing on smaller Time Frames. This can make analysis difficult because the patterns become too complex and detailed. On the other hand, when using a smaller Time Frame, the patterns are more distinct and easier to identify.
Large timeframe H4, Daily, Weekly should be applied for which technical analysis?
First, we need to determine the right time to enter the market, considering whether any news or events might affect the price volatility and trends. At the same time, choose the appropriate assets, currency pairs, or commodities to trade within a narrow volatility cycle. In this case, you can rely on H4 and D1 for technical analysis. Conversely, using smaller Time Frames like M5 and M15 in a narrow volatility cycle, where each candlestick movement might only be a few pips, can create a confusing and chaotic pattern that is hard to analyze.
Issues related to time frames
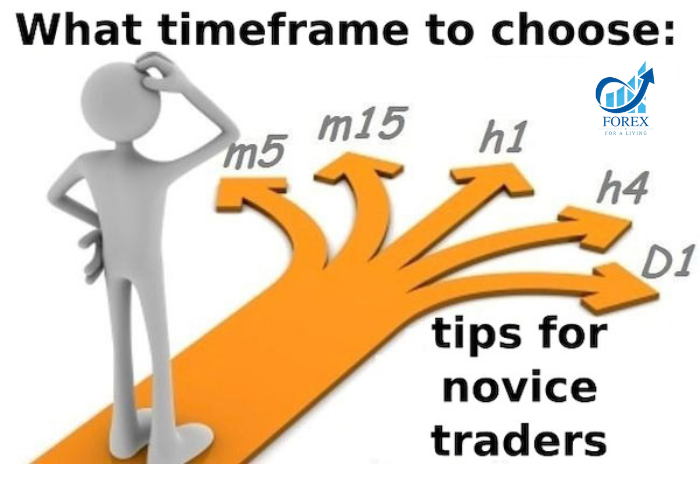
Trading by Choosing the Right Time Frame
To understand what Time Frame is, we need to look into how trading works around Time Frames. Nowadays, there are many different trading methods, such as long-term swing trading, short-term trading, and trading based on specific market timings. Finding the right trading method will help traders get closer to success in online financial transactions. When executing a trade, it’s important to focus on a certain market fluctuation range, such as the wave size (Wave), whether it is a long or short wave, how to trade it, and its characteristics. Below are the specific details:
Long-term
This is one of the most popular strategies used by traders and investors today. Traders focus on relatively long market waves, which can last for several days or even weeks. Therefore, the Time Frames that traders typically observe are usually no shorter than D1.
Short-term
In contrast to long-term trading, short-term trading involves traders focusing on smaller and shorter price fluctuations and market trends. Traders in this category often observe Time Frames with a maximum of D1.
Swing Trading
Traders are executing trades according to a long-term plan and aiming to capture waves that span several days of market fluctuations. Typically, traders who follow this plan often have limited time to invest in trading and transactions, so they usually hold positions for several days or even weeks. Therefore, the most suitable Time Frames for this analysis style are H1, H4, or D1.
Day Trading
Day trading involves capturing waves within a single day. Traders usually select Time Frames from M30 to H4. If they were to analyze from a D1 Time Frame, for instance, only one candlestick would appear for the entire day’s price movement, making it difficult to identify trends and patterns. This would complicate predictions and tactical decision-making.
Intraday
This plan typically focuses on smaller, shorter waves that usually last between 15 minutes to 1 hour. Naturally, these smaller waves do not experience significant fluctuations and may not clearly reflect the overall trend or market movement. Therefore, traders should note that with smaller waves, the potential profit or loss (in pips) over that period will also be smaller.
Scalping
![Time frame nel trading: Quale scegliere? [Significato e differenze]](http://finance-solutes.com/wp-content/uploads/2025/02/Time-frame-significato.jpg)
Traders who follow this style often have very short holding periods, ranging from just a few minutes to a few hours. They are risk-takers who enjoy speed, which is why they may place dozens to hundreds of orders in a single day. Therefore, the most suitable Time Frames for this plan are M1, M5, or M15. The market waves these traders aim for are very small, corresponding to small pip movements, typically ranging from 10 to 20 pips. In contrast, Swing Traders may see a total movement of more than 200 pips.
In summary, each trader has their own strategy and approach to trading, so selecting the right waves and pip ranges that fit their style is crucial.
When to Combine Multi-Time Frame Trading?
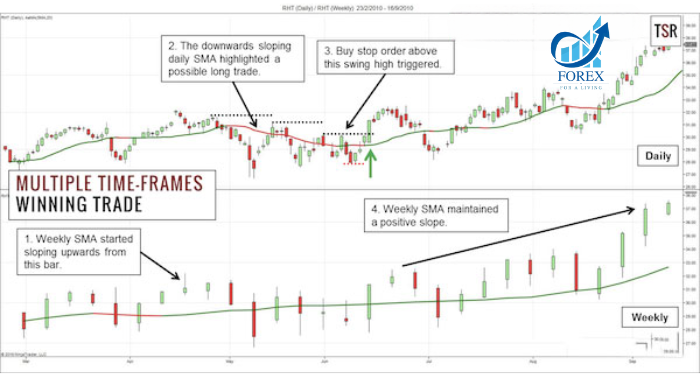
Multi-time frame trading can be highly beneficial for traders when predicting price movements and market trends. You can use multiple Time Frames in combination, but it’s important not to use too many at once, as this could lead to confusion and make analysis harder. It’s recommended to use 2-3 Time Frames at most. The largest Time Frame should be used to forecast and identify the primary market trend, the medium Time Frame is used for predicting medium-term trends, and the smallest Time Frame is used for short-term predictions and to determine entry points for trades.
Here are a few common Time Frame combinations that you can refer to: (M5, M30, H4), (M5, M15, M30), (M30, H4, D1), (H1, H4, D1), (M30, H1, H4), (H4, D1, W1)…
Using multiple Time Frames helps make predictions and confirm signals more accurately. It also provides a clearer, more objective analysis by eliminating most subjective opinions that may arise from using a single Time Frame. However, when applying any tools or methods in the market or in a trade, traders and investors should continuously hone their skills and deepen their expertise to use these strategies effectively.
General Notes
Depending on the circumstances, preferences, and trading strategies of each individual, one can choose a specific Time Frame. Every investor and trader should prepare themselves with knowledge about market trends and develop their own perspectives and judgments. They should not be easily swayed by the erratic fluctuations in the market nor blindly follow the crowd without understanding the Time Frame and trading plans.
Each type of trading we mentioned above has its own strengths and weaknesses. We cannot claim that one plan is better or more effective than another, nor can we criticize or evaluate any particular plan. Each plan will showcase its own strength based on how well it aligns with your approach and its application.
So, do you now know what Time Frame is? Regardless of the type of investor or trader you are, and whether you have a strategy or plan in place, choosing the right Time Frame that suits you will help minimize risks and provide you with a clear, comprehensive view of the market and price fluctuations, allowing you to make the most informed and suitable trades.
Forex hopes that the information shared in this article will be helpful in understanding Time Frames and assist you in joining the online financial trading market. Wishing you success.
- t.me/finance_solutes
- Website: https://finance-solutes.com
- Hotline: +1 929 5636 439 ( Hotline )
- 26 Broadway, Suite 934, New York, 10004, US
