
 XM
XM Bybit
Bybit Binance
 Robinhood
 Webull
 IC Markets
 Pepperstone
 OKX
OKX Vantage
 VT Markets
 BingX
BingX Gate.io
 Kucoin
 MEXC
MEXC Exness
 Bitget
COT report is one of the most commonly used market analysis tools in financial trading. The COT report provides detailed information on the buying/selling advisory of futures contracts by commercial traders and speculators in the market. This data can help predict future market trends and identify attractive trading opportunities. In this article, we will explore how to use the COT report to generate profits.
Overview of the COT report

What is the COT Report?
The COT report is a weekly publication that contains data on the total assets held by traders and the total number of buy/sell orders from different market participants in the U.S. futures market.
The COT report is released every Friday, typically between 9:00 and 9:30 PM Vietnam time, by the Commodity Futures Trading Commission (CFTC). This document provides investors with updated information on futures market activities, enhancing transparency in these complex exchanges, especially in the foreign exchange (Forex) market.

Futures Market
Overview
To gain a deeper understanding of the significance of the COT report, we need to discuss the futures market. The futures market, also known as the forward or deferred delivery market, is where traders enter agreements to buy or sell at a specific price in the future, predetermined at the current moment.
Tracking data from the futures market is crucial because this is where traders execute future contracts with fixed prices, providing centralized data on buying and selling orders. In contrast, the spot market does not keep transaction records and is not centralized, making it impossible to compile aggregated data for statistical purposes.
Thus, observing the futures market helps track market activity, identify participating entities, and, most importantly, analyze the transactions and capital flows of major traders.
Market Participants in the Futures Market
The COT report provides specific data for different groups of traders, each of whom has a unique impact on the market. To better understand the report, we must first identify these groups and their roles in the futures market.
Hedgers – Commercial Traders
In the futures market, commercial traders primarily aim to protect themselves against unexpected price fluctuations. This group includes agricultural producers and businesses seeking to minimize risks from commodity price changes. Additionally, banks and corporations also hedge against sudden price movements.
For example, if a company plans to purchase goods from another country but will make the payment later, it faces exchange rate risks. To mitigate this, the company can buy a futures contract for that currency at the expected delivery time, ensuring price stability. This practice, known as hedging, classifies the company as a hedger. Hedgers usually buy at low prices and sell at high prices, but their primary goal is asset protection rather than profit maximization.
Large Speculators
Large speculators in the futures market, also known as non-commercial traders, operate in contrast to commercial traders. Their primary objective is to profit from price fluctuations rather than owning assets. These traders typically hold large accounts and are considered major investors in the market. Their trading activities can significantly influence market volatility.
Non-commercial traders tend to follow trend-following principles, meaning they buy when prices rise and sell when prices fall. Additionally, they often increase their positions or place more orders until a reversal signal appears in the market.
Small Speculators
Contrarian traders generally consist of individuals or institutions with relatively small trading assets. Their trading behavior often opposes market trends, aiming to buy at the bottom and sell at the top in an uptrend or downtrend. While they may succeed in timing the market, their overall impact on price movements remains minimal.
How to read the COT report
Overview
The COT report is published by the CFTC, and readers can access it directly from the commission’s official website. This site provides real-time updates, ensuring traders always have the latest information. Upon accessing the site, users will find three different data tables:
- Current Disaggregated Reports – A detailed report on specific commodity groups, including agriculture, energy, metals, and more.
- Financial Futures Reports – A general report covering the entire financial futures market.
- Current Legacy Reports – The most commonly used report among traders, providing information on multiple markets, including Forex.
To make the COT report easier to understand, this article will focus on analyzing data from the Chicago Mercantile Exchange (CME). As the world’s largest derivatives market, CME data is highly valuable for assessing market sentiment.
Example Illustration
Accessing CME Data
To obtain COT data for analysis, follow these steps: Navigate to the Chicago Mercantile Exchange section under Current Legacy Reports. Select the Futures Only column to analyze data specifically for futures contracts. Choose between Long Format (full data) or Short Format (condensed data). For analysis, the Short Format report is usually sufficient.
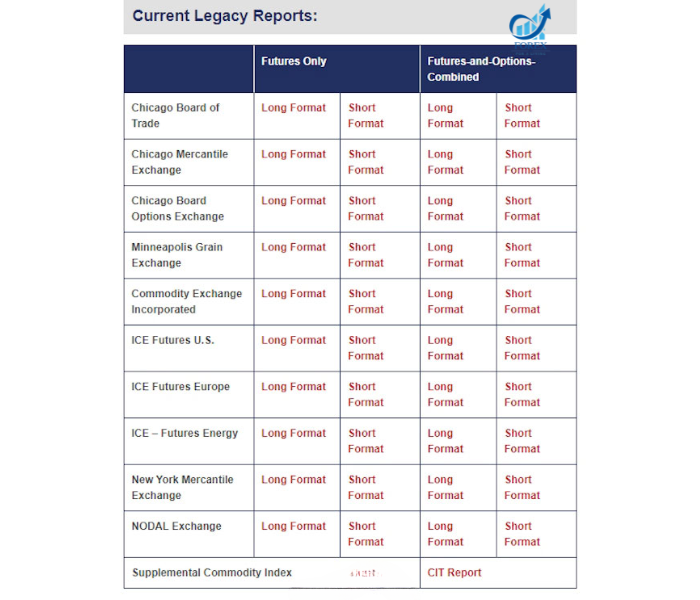
Upon accessing the report, you will see a large block of text. However, there is no need to worry, as finding relevant information is quite simple. This article will guide you step by step on what to look for.
How to find specific data in the COT report
Let’s assume you want to analyze the British pound (GBP). To do this, simply use your browser’s search function (Ctrl + F on most browsers) and enter keywords such as GBP or British pound. The search will instantly direct you to the relevant section containing data on this currency. Investors should focus on the key information listed in the GBP section, as illustrated in the example image below:
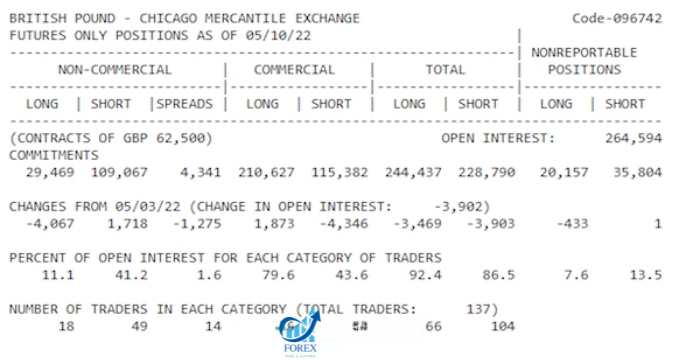
To study the GBP currency, traders should focus on the following key information:
- Commercial: Data on commitments from commercial traders, also known as Group 1.
- Non-Commercial: Data on the commitments of large and small speculators (corresponding to Group 2 and Group 3).
- Long: The number of buy contracts.
- Short: The number of sell contracts.
- Open Interest: The number of contracts awaiting execution.
- Number of Traders: The total number of traders participating in the report.
- Non-Reportable Positions: The number of positions that do not meet the reporting requirements (typically held by small traders).
Understanding the numerical Data in the report
The numerical data in the COT report corresponds to the categories listed above. For example, commercial traders (Group 1) might hold 24,469 GBP contracts, with 18 traders participating in the report. While the report contains extensive information, traders do not need to analyze every single data point. Instead, we will focus on applying this data in the next section.
Note: If you wish to track data for other assets, you can search for their names or trading symbols. The format of the provided information will be similar to the GBP example.
How to use COT data in trading?
Now that we understand the COT report and how to read it, the next step is learning how to apply this data to forex trading.
COT indicator on charts
The key question after reading the report is: how do we convert these numbers into trading opportunities? Fortunately, despite being published as a text-based report, COT data has been developed into a technical indicator integrated into the TradingView platform, making market analysis more convenient.
However, traders should note that the COT report is published weekly. Therefore, it is most useful for long-term investors who use higher timeframe charts, such as weekly charts or higher.
In which, the red line represents commercial traders (Group 1). The green line represents large speculators (Group 2). The blue line represents small speculators (Group 3). In the indicator, buy positions are shown above zero, while sell positions are displayed below zero.
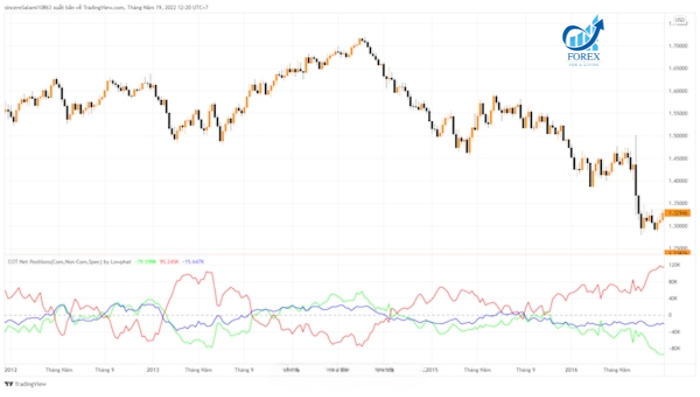
On reality, we can focus on the index of large speculators (green) in the COT report because Group 1 mainly uses COT for risk minimization, and Group 3 has an impact too small to be concerned with (you can hide the red and blue lines if needed).
Finding Potential Trading Opportunities
Overview
Now, we will focus on how to identify trading opportunities using the COT report. It is essential to determine where net long or net short positions reach extreme values and then look for potential reversal trading opportunities.
The principle of this method is that when the long position reaches its highest level (indicated by the green line peaking), it signifies the peak of market sentiment when everyone is buying. This is the opportunity for us to sell our position.
The reason we sell when everyone is buying is simple: when everyone has already bought, there is no one left to buy, meaning the price cannot rise any further and can only go down. Therefore, we seek opportunities to sell. Conversely, when the short position reaches its maximum level (the green line bottoms out), it marks the peak of bearish sentiment, and we look for opportunities to buy.
Illustrative Example
In the weekly chart of the EUR/USD currency pair from 2008 to 2010, we can observe that when market sentiment was bearish (the green line declined), the EUR/USD exchange rate also decreased. In September 2008, the COT report showed a bottom, indicating that bearish sentiment had peaked. At that point, investors started buying EUR futures contracts, contributing to a strong upward trend in the EUR/USD exchange rate afterward. By October 2009, bullish sentiment had reached its maximum (the green line peaked), and shortly after, the EUR/USD exchange rate began to decline.
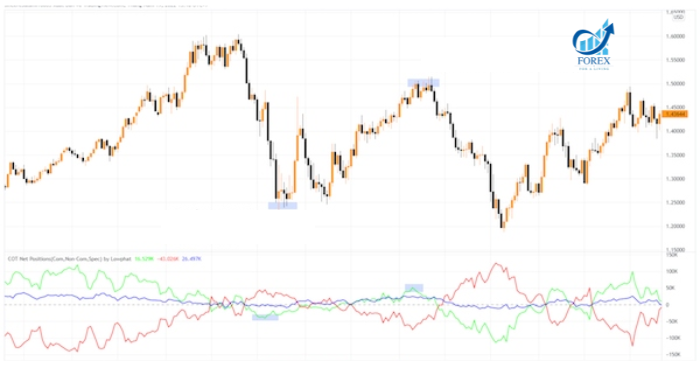
Using the COT index, we can capture two very strong market conditions within the examined period, with significant fluctuations reaching thousands of pips. Although COT is a highly useful indicator for identifying market tops and bottoms, to trade successfully, traders need to utilize other technical analysis tools such as Price Action on smaller timeframes to find optimal entry points. After that, traders should hold positions for the long term to maximize profit potential from the market.
Note
One interesting observation on the COT index is that the red and green lines always move in opposite directions, highlighting the difference in behavior between commercial traders and large speculators. Meanwhile, the blue line typically fluctuates slightly around the 0 level, further emphasizing the relatively minor role of small speculators in overall market sentiment and price changes.
The COT report is a valuable tool for assessing market sentiment and forecasting price trends in the forex market. However, to achieve trading success, using the COT index should be combined with other technical analysis methods such as Price Action, Fibonacci, or other technical indicators. Additionally, patience and psychological control are crucial factors in achieving favorable trading results based on the COT report.
We hope this insight into the COT report helps investors better understand the importance of tracking market sentiment in forex trading. Wishing you success in market analysis and achieving great results in forex trading!
- t.me/finance_solutes
- Website: https://finance-solutes.com
- Hotline: +1 929 5636 439 ( Hotline )
- 26 Broadway, Suite 934, New York, 10004, US
