
 XM
XM Bybit
Bybit Binance
 Robinhood
 Webull
 IC Markets
 Pepperstone
 OKX
OKX Vantage
 VT Markets
 BingX
BingX Gate.io
 Kucoin
 MEXC
MEXC Exness
 Bitget
What is a Supply and Demand Zone? This is a key concept in the financial market, representing crucial areas on the chart. The interaction between supply and demand creates ideal decision points for trading. Understanding and applying supply and demand zones is an effective way for investors to achieve profits in the Forex market. Let’s explore the concepts and opportunities that supply and demand zones offer with Trader Forex!
What is a supply and demand zone?
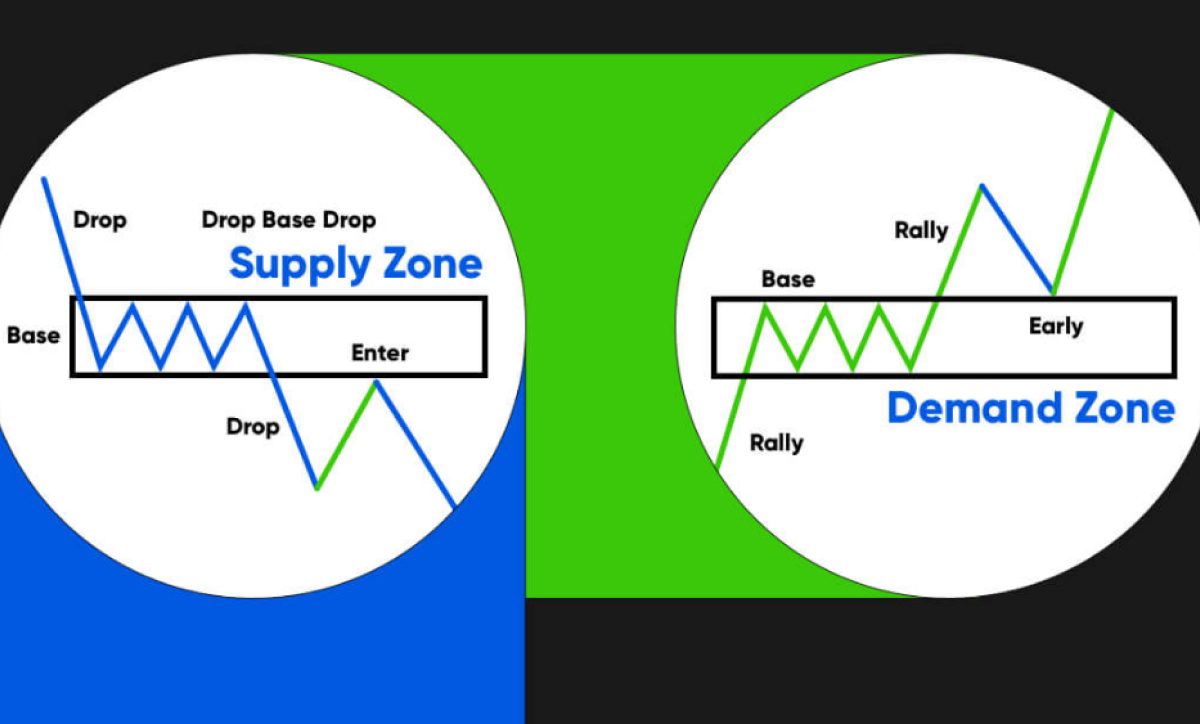
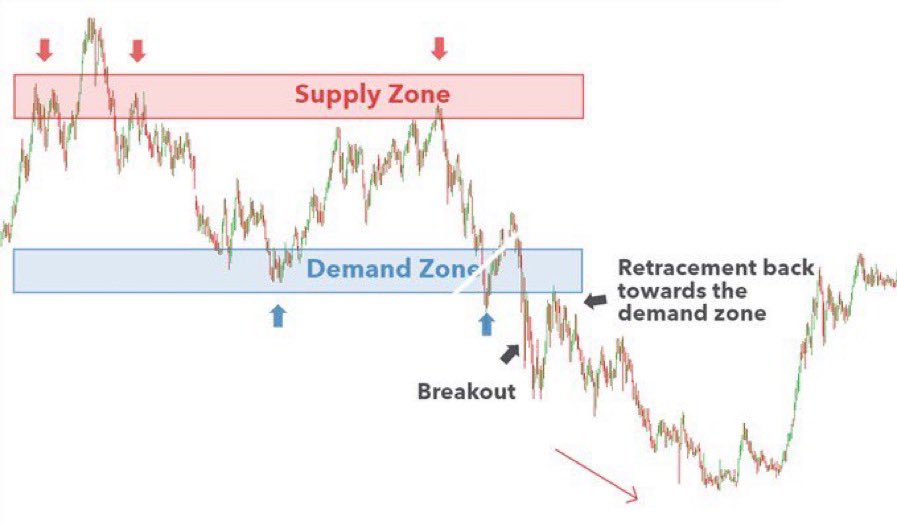
During the accumulation phase, after a downward cycle comes to an end due to a shortage of supply, buying demand starts to emerge in preparation for a price increase. This phase is also known as the demand zone (where demand appears).
On the contrary, the distribution phase occurs when an uptrend halts, and prices have risen significantly, causing demand to weaken while supply increases sharply. As a result, this area is referred to as the supply zone.
Structurally, supply and demand zones are similar to extended support and resistance areas, where price tends to reverse or retrace. Let’s look at an example to analyze the role and functionality of supply and demand zones, where either supply dominates or demand takes control.
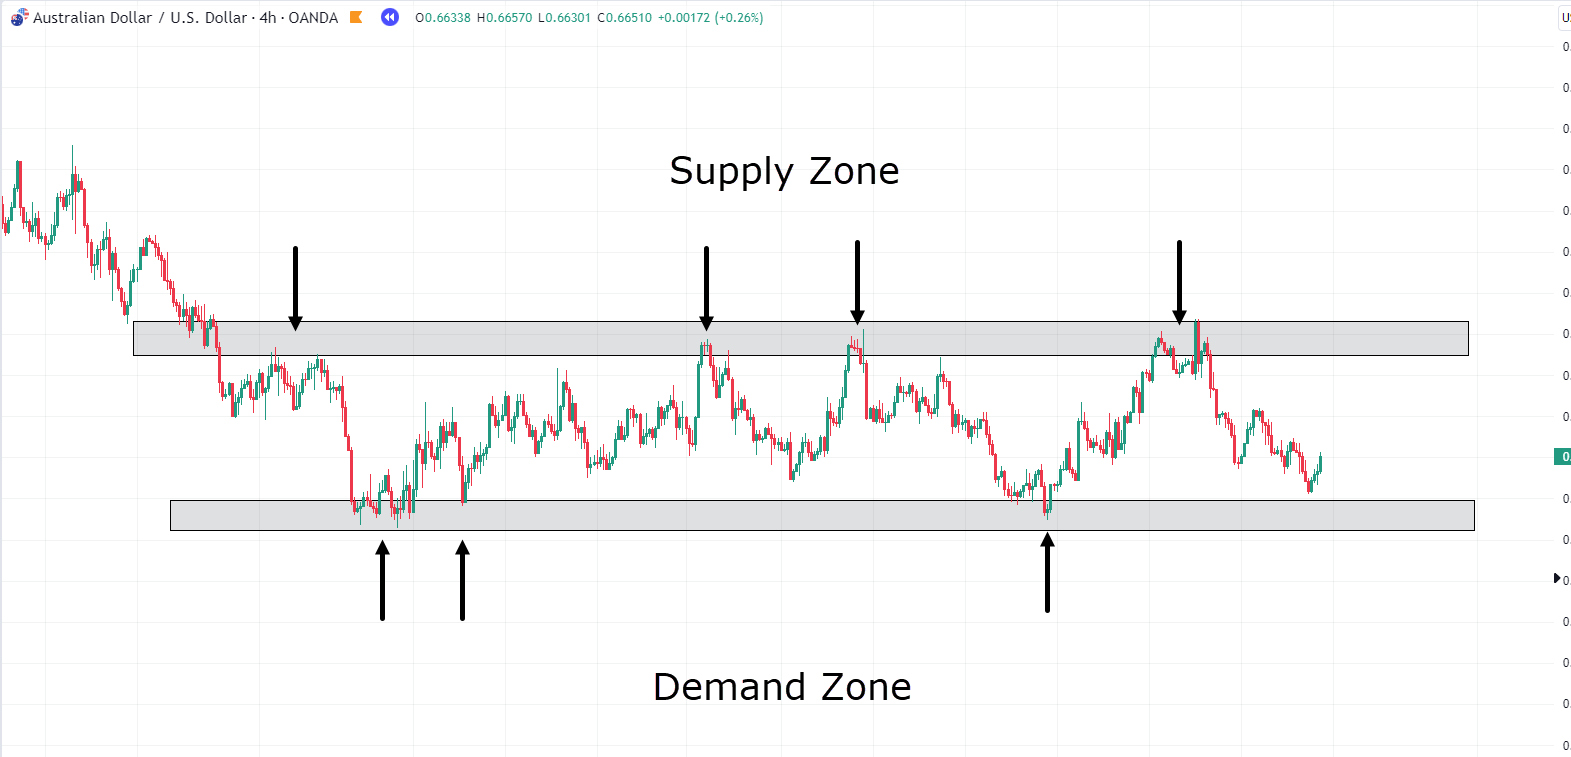
- For a supply zone, when the market price reaches this area, it tends to drop. Investors can profit by executing sell trades at this level.
- Conversely, in a demand zone, strong buying pressure pushes prices higher. Investors can capitalize on this movement by entering buy trades for significant profits.
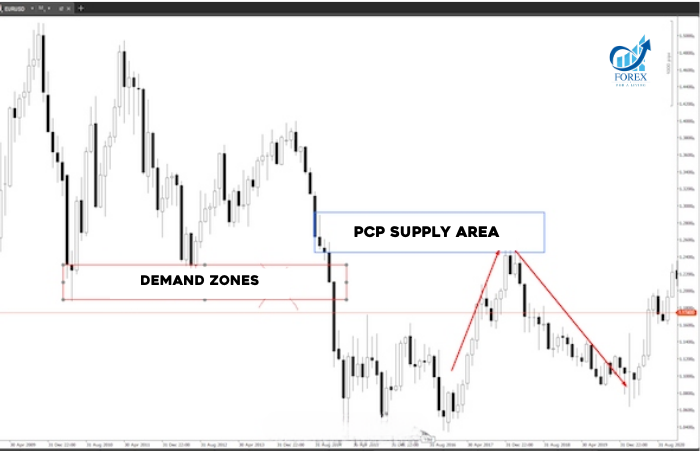
- When a supply zone is broken, it can turn into a demand zone, and similarly, when a demand zone is broken, it may transform into a supply zone.
Identifying supply and demand zones and drawing them on the xhart
How to identify supply and demand zones?
Overview
First, you need to pinpoint supply and demand zones on the chart to trade effectively. Due to market fluctuations, it is easy to confuse these zones with other areas such as traditional support and resistance. However, to clearly distinguish supply and demand zones, we can use the following simple indicators:
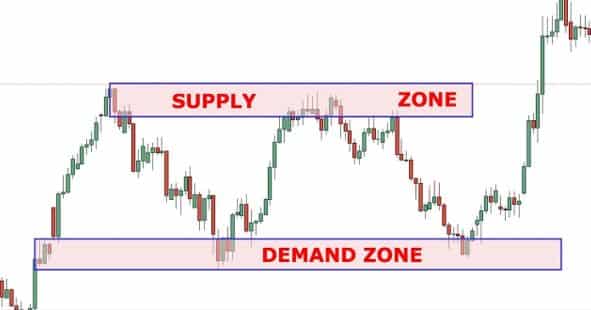
- When the price moves sideways (without a clear trend) for a short period, typically under 10 candlesticks, it forms a base zone. From this base zone, we can identify supply and demand areas, as price tends to shift direction after sufficient accumulation in the base zone.
- In another scenario, when the price does not move sideways but instead changes abruptly, often with a single candlestick, there is no base zone. Instead, signals such as the Hammer candlestick, Engulfing candlestick, and other typical candlestick patterns appear…
Identifying strong base zones
Utilizing strong signals within supply and demand zones is a key strategy for more effective market analysis. In reality, supply and demand zones vary in strength. To simplify and enhance the accuracy of analysis, traders should focus on strong base zones with the following key characteristics:
- Narrow price ranges often occur when candlesticks in the base zone move sideways, are small in size, and have low volatility. If the price range is too wide, it indicates strong price fluctuations and a lack of clear reversal signals.
- If the base zone consists of fewer than 10 candlesticks, but the accumulation phase lasts too long, it signals weakness or uncertainty.
- When price moves sharply after exiting an accumulation or distribution phase, it suggests a strong breakout, reinforcing the significance of the supply or demand zone.
- The most reliable supply and demand zones are those that the price has never revisited after forming. If these zones are tested multiple times, their reliability diminishes.
- When a supply or demand zone forms with a single candlestick, that candlestick should exhibit a false breakout pattern, such as a Spring candlestick. These patterns have long wicks, signaling a new price direction but quickly retracting, indicating an impending reversal.
Note
Traders often confuse supply and demand zones with traditional support and resistance levels. Although they appear similar, a deeper understanding of each concept allows for clear differentiation.
Determining support and resistance levels only occurs after the price has formed a clear top or bottom and makes it possible to apply them as the price continues to approach that area in the future. On the contrary, with supply and demand zones, if you recognize them carefully, you can detect them as soon as they first form and apply them immediately with even greater efficiency when the price returns to that zone later.
In practice, identifying supply and demand zones is more complex than spotting support and resistance levels. To maximize their potential, traders need to practice extensively until they become second nature.
Steps to draw supply and demand zones on a chart
Unlike support and resistance levels, which can be represented by a simple line or a narrow zone around peaks and troughs, supply and demand zones tend to cover a wider price range. Therefore, accurately drawing them requires focus and practice.
Whether a supply or demand zone forms from a base zone or a single candlestick, the drawing method remains the same. However, zones formed from base areas tend to be more reliable and easier to recognize.
After identifying a supply or demand zone on the chart, the next step is to draw them accurately using the rectangle tool on platforms like MT4, TradingView, or any other charting software.
Drawing a supply zone
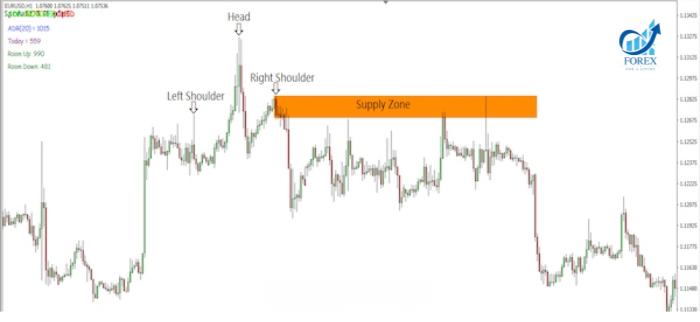
Start from the opening price of the last bullish candlestick before a strong downward move. If the price was moving sideways before the drop, locate the last bullish candlestick before consolidation, rather than using bearish candles.
The rectangle’s upper boundary should be set at the highest price point (including wicks) in the base candlestick cluster.
Drawing a Demand Zone
Opposite to supply zones, when identifying a demand zone on the chart, the following principles can be applied for accurate drawing:
- The starting point of the demand zone corresponds to the opening price of the last bearish candlestick before a strong upward price movement.
- The demand zone extends from the starting point to the lowest price level within the base area (including the candlestick wicks).
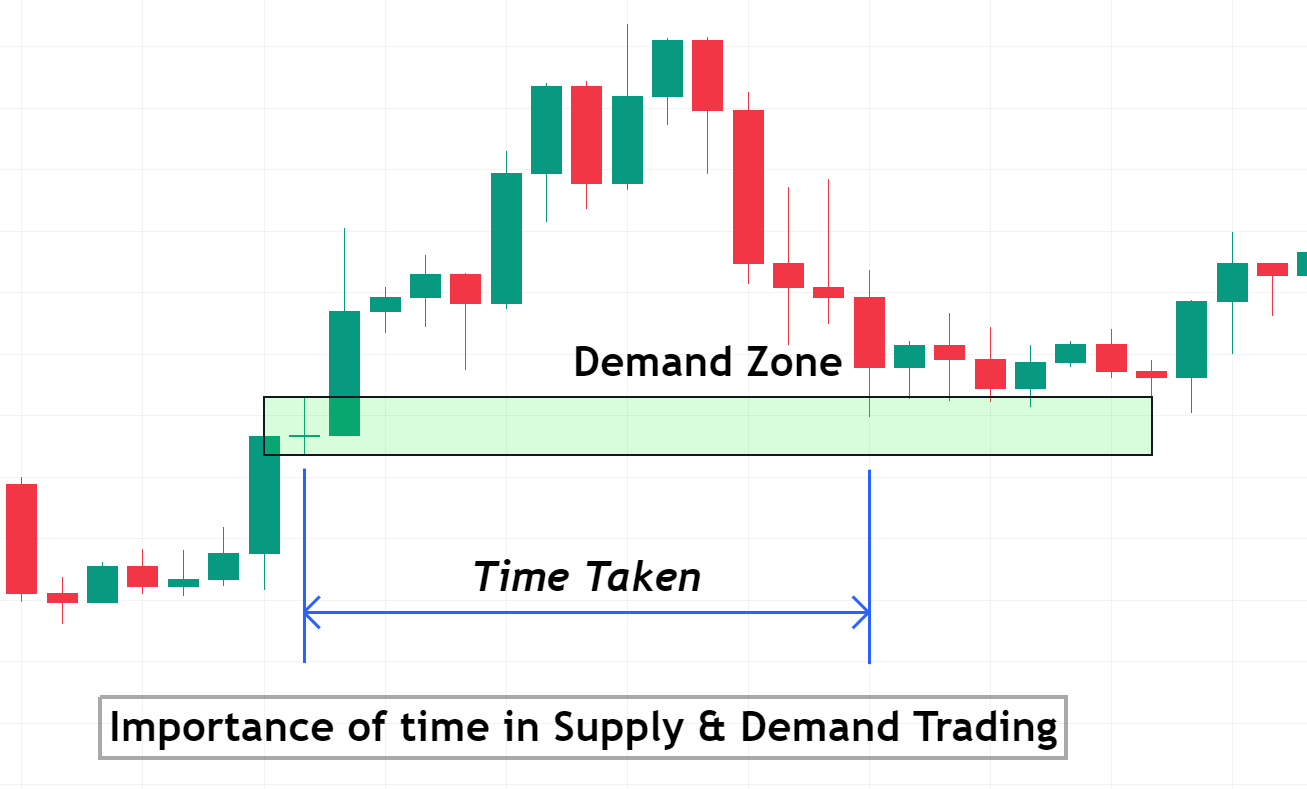
We can adjust the size of the rectangle for future use. This rectangle expands to display the supply and demand zones on the chart. These zones indicate potential price reversals upon future contact.
To understand why we need to start with a bullish candle before a price drop or a bearish candle before a price increase, we can examine the trading behavior of banks or large institutions for an explanation.
In reality, banks do not place trades based on the current market trend. If there is a bullish candle, they do not place buy orders, and they do not place sell orders after a bearish candle. Therefore, to accurately determine supply and demand zones, we need to consider the opposite direction.
Some principles for applying supply and demand zones
Understanding the principles of using supply and demand zones is essential to effectively leverage this signal. Traders can use these zones for reversal trading, similar to support and resistance strategies. Specifically, we can place sell orders at supply zones and buy orders at demand zones.
However, traders should focus on supply and demand zones that have not yet been reacted to by price, especially those that have never been tested before.
Newly formed supply and demand zones tend to be more effective. When we identify a supply or demand zone immediately after it appears, that is the best time to apply the supply and demand trading method.
Each time the price tests a supply or demand zone, the value of that zone gradually decreases. Similar to a rubber ball, supply and demand prices operate based on the supply and demand zone. When the ball repeatedly hits the ground, its bounce diminishes until it no longer bounces.
This is how the price reacts to supply and demand zones. When a new supply or demand zone forms, it represents the true state of the market, indicating a shift in supply and demand. In subsequent tests, market psychology assumes that the price will react to that zone, but over time, this assumption weakens until the old supply or demand zone becomes irrelevant.
The law of supply and demand in Forex
In supply and demand trading in Forex, understanding the concept of supply and demand zones and the law of supply and demand in this market is crucial. The market cycles through four main phases: accumulation, expansion, distribution, and decline.
Market structure and supply and demand zones are closely related. In supply and demand analysis, we focus on the accumulation and distribution phases, applying the law of supply and demand.
- The law of demand states that when the price increases, the number of buyers decreases, and conversely, when the price decreases, the number of buyers increases.
- The law of supply states that when the price increases, the number of sellers also increases, and when the price decreases, the number of sellers decreases.
- When a demand zone is broken, it turns into a supply zone, and vice versa.
Supply and demand trading in Forex
Supply and demand in the Forex market function similarly to other markets, such as the agricultural market. However, in Forex, supply and demand operate at a much faster pace and can sometimes be difficult for newcomers to understand.
Forex is the largest financial market in the world due to the high demand for currency trading. Currency serves as the foundation for global economic activity, and when one economy wants to trade with another (using different currencies), currency exchange becomes essential. In short, supply and demand in Forex are determined by analyzing the number of buyers and sellers in the market.
The impact of supply and demand on prices
When the South African Reserve Bank (SARB) changes interest rates, it affects supply and demand in the market. When interest rates rise, the cost of foreign exchange transactions also increases. This means that investors holding trades during these currency conversions will earn higher interest rates than before. If other market factors remain unchanged, more traders will want to buy, and fewer traders will want to sell. This happens because the opportunity cost of selling (currency conversion payments) becomes more expensive.
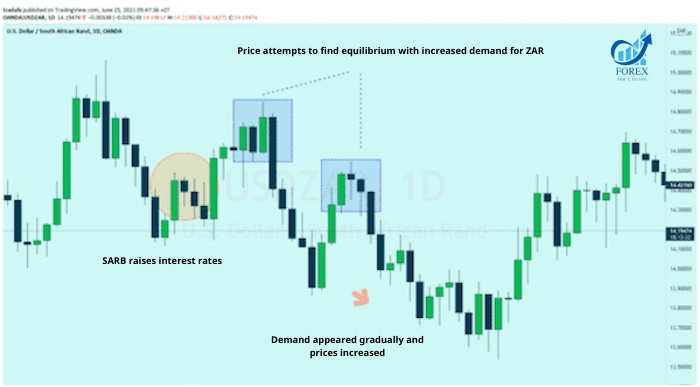
From the illustration, we can see that initially, the price rises to find a level where no more buyers are willing to pay a higher price. When this happens, sellers take control, and the price starts to decline. Once the price drops sufficiently (as shown by the red circle), traders re-enter the market.
The rising yield, combined with the additional conversion cost from holding a long ZAR position, makes this lower price level more attractive. As more buyers enter, the price increases to reflect the growing demand. This is the process of price equilibrium discovery, which occurs across multiple timeframes and markets worldwide.
How to trade supply and demand zones in Forex
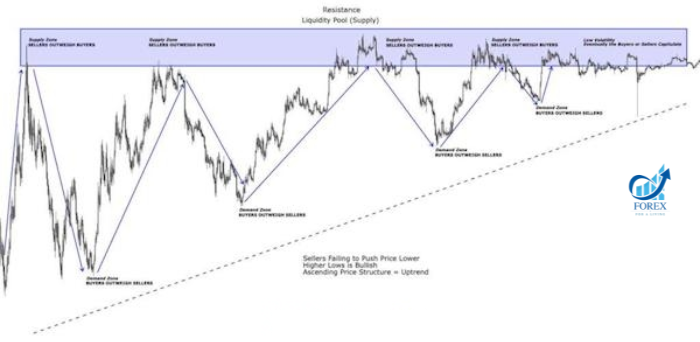
Typically, the price moves up to a resistance area known as the “supply zone.” This is where sellers see a good opportunity to sell when the price has risen to a relatively overbought level. Conversely, the same principle applies to currency pairs that drop to a relatively low level, known as the “demand zone.” This is where buyers believe there is a good opportunity to buy.
Experience in applying supply and demand zones in Forex
Use higher timeframes
One crucial tip for using supply and demand zones in Forex is to analyze higher timeframes to identify these zones. By zooming out on the chart, you can better observe areas where the price has previously bounced. Ensure that you use appropriate charts when switching between different timeframes. To mark supply and demand zones, you can draw a rectangle on the chart. Keep in mind that supply and demand zones do not always appear together, and often, currency pairs will only exhibit one of these zones at a time.
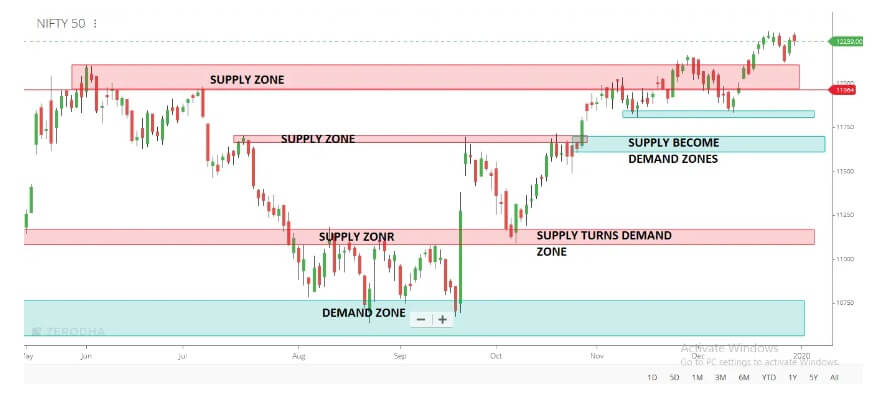
Identify strong breakout moves in supply and demand
A key experience in using supply and demand in Forex trading is identifying strong breakout moves beyond potential supply or demand zones. Certain price levels provide value to traders, and when institutional traders and large banks recognize this value, they seize the opportunity.
Price action often moves rapidly when value is identified or when value starts to diminish. In many cases, this occurs at the same price level, increasing the likelihood that it is a significant value zone. Therefore, identifying and tracking these strong moves can help you spot potential supply or demand zones on your trading chart.

Use Indicators
When trading Forex, an important tip for new traders is to use indicators to identify support levels and demand zones. One effective way to do this is by incorporating daily or weekly pivot points into your chart. Pivot points can help recognize or confirm key supply and demand zones in your trading analysis.
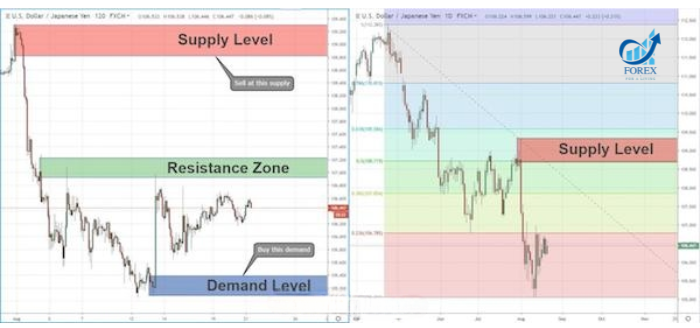
Traders should look for support and resistance levels that align with supply and demand zones. These levels can serve as critical points on the chart, where significant price movements may occur when the price approaches or breaks through them. By analyzing pivot points and support/resistance levels, new traders can improve their ability to identify supply and demand zones, leading to higher-probability trading decisions.
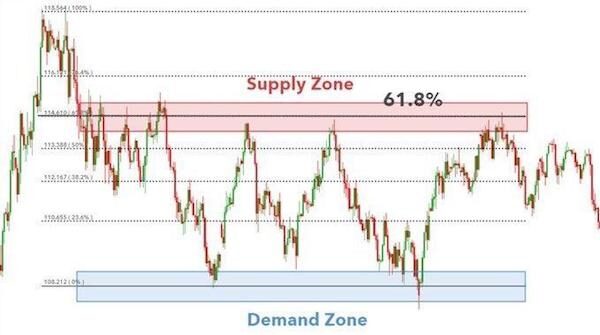
Additionally, traders can use Fibonacci levels to enhance the accuracy of identifying reversal points within supply or demand zones. The 61.8% Fibonacci retracement level is one of the most significant, often acting as a key turning point. When the price reaches or surpasses this level, a notable trend shift may occur. Therefore, incorporating Fibonacci levels into your strategy can help new traders pinpoint precise entry and exit points in their trades.
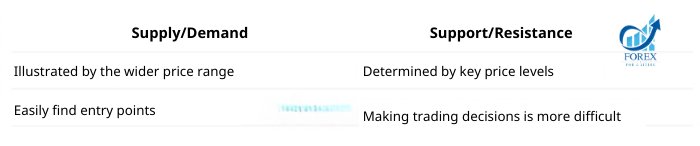
Supply/Demand vs. Support/Resistance
Key Differences
Support and resistance are price levels that the price cannot overcome or break. Supply and demand are broader areas that represent the interaction between buyers and sellers on a chart.
Using Support/Resistance to trade with supply and demand
- Supply and Demand Trading: Before trading based on supply and demand, traders must assess whether the market is changing. Monitoring factors like economic news or political conflicts can help predict market movements. Based on this assessment, traders decide to trade within a range or use breakout strategies.
- Range Trading: Range trading assumes the market will remain stable. Traders identify support and resistance levels to buy and sell accordingly. Charts will indicate points where demand exceeds supply (causing price increases) or supply exceeds demand (causing price drops).
- Breakout Trading: Breakout trading anticipates market shifts. Traders wait for the price to break through support or resistance levels, forming new highs or lows. The goal is to buy when the price is rising and sell later at a higher price or sell when the price is falling and buy back at a lower price.
Identifying the value of supply and demand zones in Forex trading is crucial and highly reliable, although it may be more challenging to recognize and apply compared to support and resistance levels. However, with practice and familiarity, these zones can become a powerful tool that yields significant profits.
That being said, in the highly volatile Forex market, no tool or indicator can guarantee 100% accuracy. Therefore, it’s essential to learn and apply different strategies to diversify your approach and adapt to various market conditions. Wishing you success in your trading journey!
- t.me/finance_solutes
- Website: https://finance-solutes.com
- Hotline: +1 929 5636 439 ( Hotline )
- 26 Broadway, Suite 934, New York, 10004, US
