
 XM
XM Bybit
Bybit Binance
 Robinhood
 Webull
 IC Markets
 Pepperstone
 OKX
OKX Vantage
 VT Markets
 BingX
BingX Gate.io
 Kucoin
 MEXC
MEXC Exness
 Bitget
The Double Top and Double Bottom patterns are two useful models for traders. Besides the forex market, they are also applied in the stock market. Moreover, both of these patterns are highly flexible. So, what are the Double Top and Double Bottom patterns? How are they applied in forex trading? Let’s explore with Finance Solutes in today’s article.
1. DOUBLE TOP PATTERN
The Double Top pattern is identified by two peaks formed on the chart, signaling an impending bearish reversal. The measured price drop between these two peaks helps identify the resistance level at the price’s high point. After the first peak, the price retraces for a while before climbing again to form the second peak. However, market strength gradually weakens and fails to break above the first peak’s price level.
The slowdown in momentum can be observed through a weakening second peak on oscillators like RSI. Sometimes, the market may slightly surpass the first peak, even if only briefly. This minor and temporary breakout above the first peak’s price level can further confirm that the uptrend is about to reverse and turn downward.
The neckline is formed at the bottom of the trough between the two peaks. A price breakout below this neckline confirms the Double Top pattern. The confirmation of a downtrend is also reinforced when the price breaks through this critical support level (neckline).
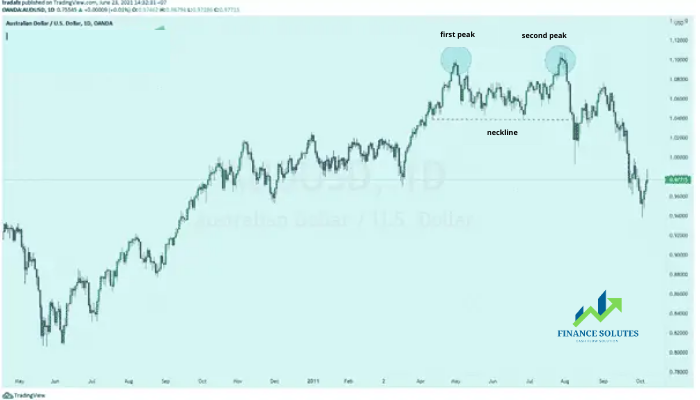
1.1. How to identify the double top pattern
- Identify two distinct peaks with similar width and height.
- The gap between the peaks should not be too small—it depends on the time frame.
- Confirm the neckline/support level.
- Use other technical indicators to support the bearish signal, such as moving averages and oscillators.
1.2. How to trade the double top pattern
The Double Top pattern is commonly used in forex and stock markets as a sell signal or a sign of price decline. The charts below will help you observe how this pattern is used in different ways to determine entry and exit points.
-
Double Top pattern in the USD/JPY chart:
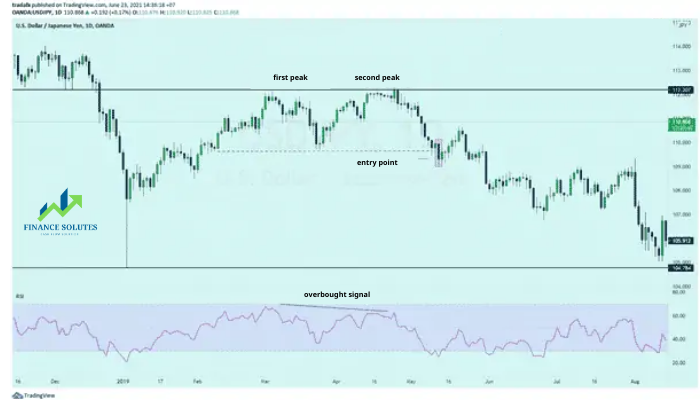
The chart above is a weekly USD/JPY chart. The Double Top pattern formed after a prior uptrend, with the first peak reaching a resistance level, accompanied by an overbought signal indicated by the RSI oscillator. After this peak, the market began to weaken, forming the characteristic trough between the two peaks. The second peak then developed slightly higher than the first, even breaking resistance for a short period.
Interestingly, the RSI did not indicate overbought conditions despite the resistance breakout. This confirms a divergence between the market price and the RSI oscillator—a sign of slowing momentum. Additionally, the divergence itself signals a bearish trend.
The entry point for this trade is confirmed when the price closes below the neckline. The resistance level connecting the two peaks can be used as a stop-loss level, while the previous swing low before the Double Top formation can serve as a target level. Fibonacci levels can also be applied to identify stop-loss and profit targets using a price action approach. In terms of risk management, this trade maintains a risk-reward ratio of approximately 1:1.2.
-
Double Top pattern with Ryanair Holdings PLC (LSE):
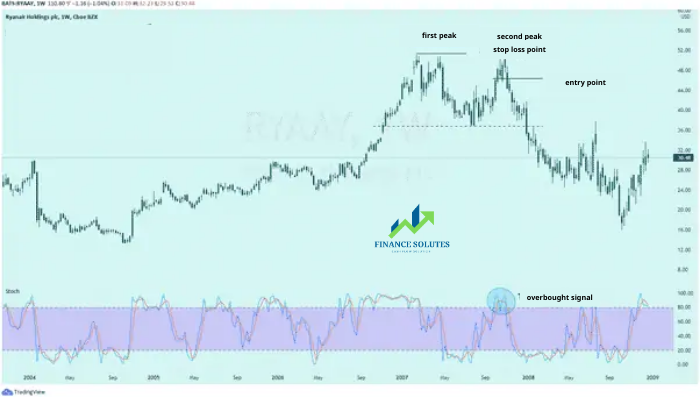
Stock market movements are often displayed in smoother charts. In this stock example, oscillators have been applied to demonstrate the variety of supporting tools that can be used alongside the Double Top pattern.
The Ryanair Holdings PLC (LSE) stock recently formed a Double Top pattern. This type of trading setup allows traders to enter a trade immediately after the second peak forms to take advantage of a larger downward movement, rather than waiting for confirmation (as discussed earlier). The stop-loss is set at the first peak, while the target level aligns with the neckline of the pattern. The Stochastic indicator is used to confirm the entry point by detecting overbought conditions.
2. DOUBLE BOTTOM PATTERN
The Double Bottom pattern consists of two bottoms forming at similar price levels, signaling a potential bullish reversal. When the price drops and then rebounds twice in succession, it suggests the presence of a support zone at these bottom levels.
Consider the example in the chart below. The Double Bottom pattern appears at the end of a downtrend and resembles the letter “W”. The price declines, then recovers slightly, before falling again to a new low. However, the market fails to push the price lower, indicating that sellers are losing strength. As a result, the price rebounds sharply from this area. The bullish confirmation is established when the price breaks above the critical neckline level.
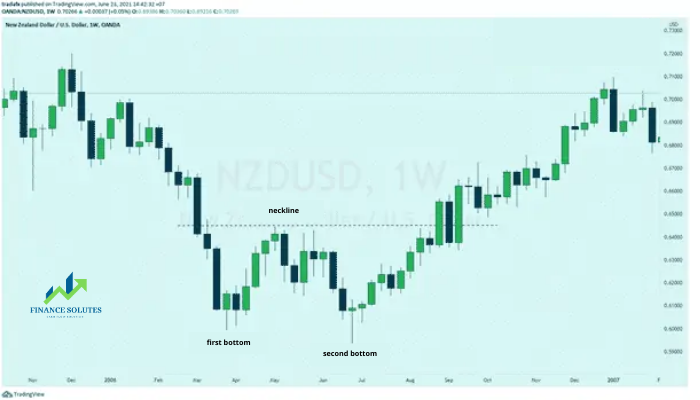
The Double Bottom pattern signals a bullish reversal. Unlike the Double Top pattern, where confirmation occurs when the support level (neckline) breaks, the Double Bottom pattern is confirmed when the price breaks above the resistance level between the two bottoms. Both Double Top and Double Bottom patterns are powerful technical tools used by traders in major financial markets, including forex.
2.1. How to identify the double bottom pattern
- Identify two distinct bottoms with similar width and height.
- The gap between the bottoms should not be too small—it depends on the time frame.
- Confirm the neckline/resistance level.
- Use other technical indicators (such as moving averages and oscillators) to support the bullish signal.
- Be cautious when trading against a strong trend.
2.2. How to Trade the Double Bottom Reversal Pattern
The Double Bottom pattern is commonly used in forex and stock markets as a buy signal or an indication of a bullish trend. The chart below illustrates how this pattern is used in both markets.
-
Double Bottom Pattern in the NZD/USD chart:
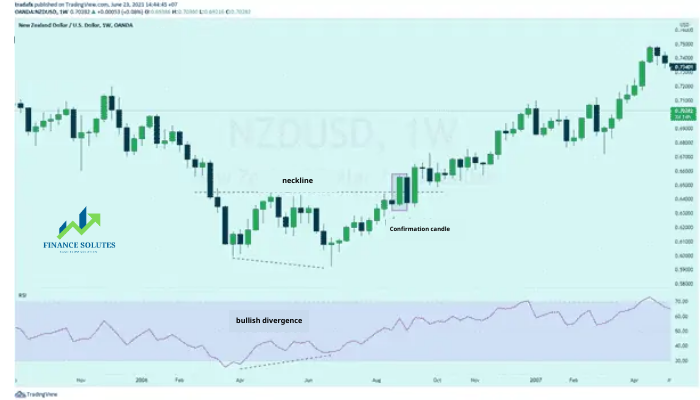
The chart above shows a Double Bottom pattern emerging after a mild downtrend. When used alongside a technical oscillator (RSI), traders gain additional confidence due to the presence of bullish divergence, signaling a potential reversal of the previous downtrend.
The stop-loss level is set at the lowest point of the two bottoms. From this level, traders can use a risk-reward ratio of 1:2 to determine a profit target or apply price action analysis by identifying key levels.
This trading approach becomes more reliable when a confirmation candle forms and closes above the neckline. While this technique carries higher risk, it also offers a higher probability of profit.
-
Double Bottom Pattern in the Apple Inc. chart:
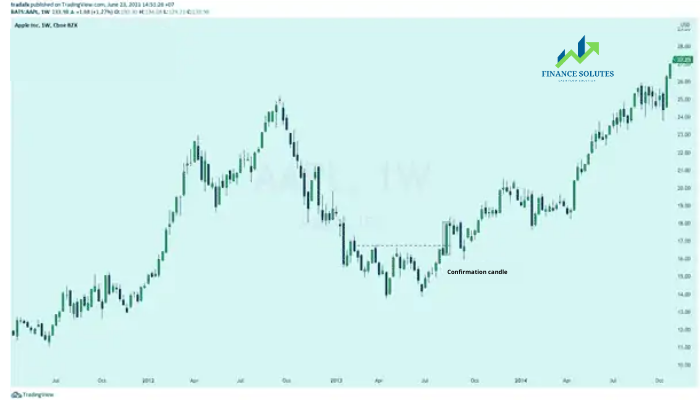
The chart above illustrates a Double Bottom pattern in Apple Inc.’s stock chart. The identification and appearance of the Double Bottom pattern remain consistent across both forex and stock markets. In this example, the price action confirms the breakout of the neckline by closing above it, signaling an ideal buying opportunity. The confirmation candle closes above the neckline after testing some resistance levels, indicating stronger bullish momentum pushing the price higher.
When trading against a strong downtrend, caution is advised even if a Double Bottom pattern appears. It is crucial to align supporting factors and confirm signals before entering the market. Even with all confirmations in place, proper risk management is essential in any trade to avoid potential losses.
3. SUMMARY
In today’s article, Finance Solutes has shared insights into the Double Top and Double Bottom patterns, which are widely used in the forex market. We have also outlined practical trading strategies to effectively utilize these patterns in real-world scenarios.
We hope this guide helps you in your trading and forex investment journey.
Wishing you success in your trading career!
- t.me/finance_solutes
- Website: https://finance-solutes.com
- Hotline: +1 929 5636 439 ( Hotline )
- 26 Broadway, Suite 934, New York, 10004, US
