
 XM
XM Bybit
Bybit Binance
 Robinhood
 Webull
 IC Markets
 Pepperstone
 OKX
OKX Vantage
 VT Markets
 BingX
BingX Gate.io
 Kucoin
 MEXC
MEXC Exness
 Bitget
The Pennant pattern is a continuation pattern that appears in the forex market, helping traders predict upcoming price movements. Although it shares similarities with the Triangle pattern, there are key differences that traders should be aware of.
In this article, you will learn how to identify the Pennant pattern, understand its significance and formation, and most importantly, how to utilize it effectively to improve your trading performance.
1. WHAT IS THE PENNANT PATTERN?
The Pennant pattern is a continuation pattern that occurs after a strong upward or downward price movement, followed by a brief consolidation phase, before the trend resumes in its original direction.
Visually, it resembles a small symmetrical triangle, which is why it is called a Pennant. The pattern is formed by multiple candlesticks in the forex market. Depending on the direction of movement, this pattern is classified as either a bullish or bearish Pennant.
1.1. Characteristics of the Pennant Pattern
When looking at the Pennant continuation pattern, you will see the following:
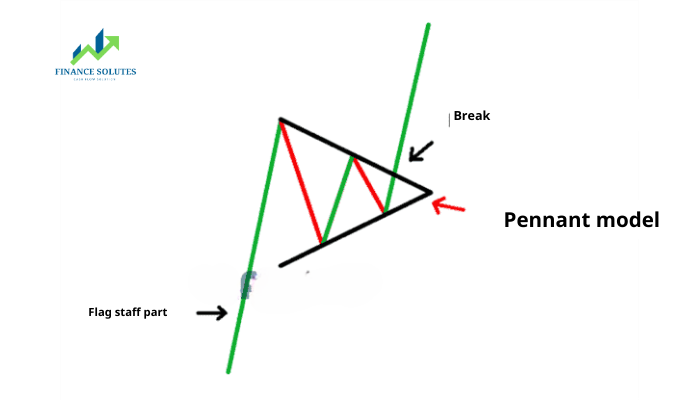
Flagpole: The Pennant pattern always begins with a flagpole; this helps you distinguish it from other patterns (such as the Symmetrical Triangle pattern). The flagpole is the initial strong movement that precedes the pennant.
Breakout Levels: There will be two breakout points; one at the end of the flagpole and another after the accumulation phase, where the uptrend or downtrend continues.
The Pennant itself: The Pennant is a triangular pattern formed when the market moves sideways, positioned between the flagpole and the breakout point. Two converging trendlines form a triangle – the Pennant.
You can see these characteristics below for a bullish Pennant pattern:
1.2. Bullish Pennant Pattern
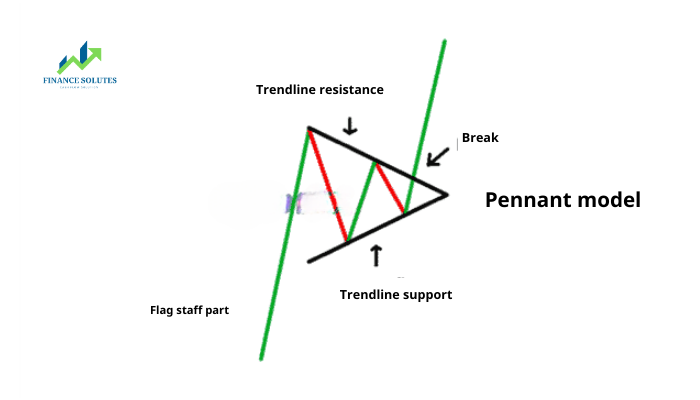
The Bullish Pennant pattern is a continuation pattern that occurs during strong uptrends. This pattern is formed by an upward flagpole, a consolidation phase to strengthen the trend, and then the continuation of the uptrend after a breakout. Traders look for a breakout above the Pennant pattern to capitalize on the new bullish momentum.
1.3. Bearish Pennant Pattern
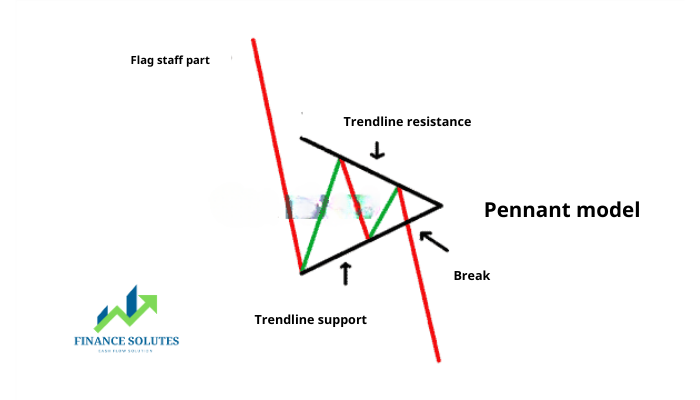
The Bearish Pennant pattern is simply the opposite of the Bullish Pennant pattern. It is a continuation pattern that occurs during a strong downtrend. This pattern always begins with a flagpole – a sharp price decline – followed by a consolidation phase to reinforce the downward movement. This consolidation forms a triangular shape, known as the Pennant. Afterward, a breakout occurs, and the downtrend resumes. Traders may look for selling opportunities when the price breaks below the Pennant.
2. DIFFERENTIATING THE PENNANT AND TRIANGLE PATTERNS
The Pennant pattern closely resembles the Triangle pattern; however, there are some key differences between these two patterns that every trader should understand to trade successfully in the forex market.
Here are the important distinctions to keep in mind:
- The Pennant pattern must begin with a strong upward or downward movement resembling a flagpole. If there is no flagpole, it is a Triangle pattern.
- The Pennant pattern tends to form a shallow retracement, usually less than 38% of the flagpole. A deep retracement indicates a Triangle pattern rather than a Pennant.
- This pattern is characterized by the continuation of an uptrend or downtrend.
- It is also a short-term pattern, typically completed within one to three weeks. The Triangle pattern usually takes longer to form.
3. HOW TO TRADE THE BULLISH/BEARISH PENNANT PATTERN
When trading, a similar approach can be applied to both the Bullish and Bearish Pennant patterns. However, the Bullish Pennant pattern favors buy entries, while the Bearish Pennant pattern favors sell entries. The example below illustrates how to trade a Bullish Pennant pattern that appears on the GBP/NZD chart.
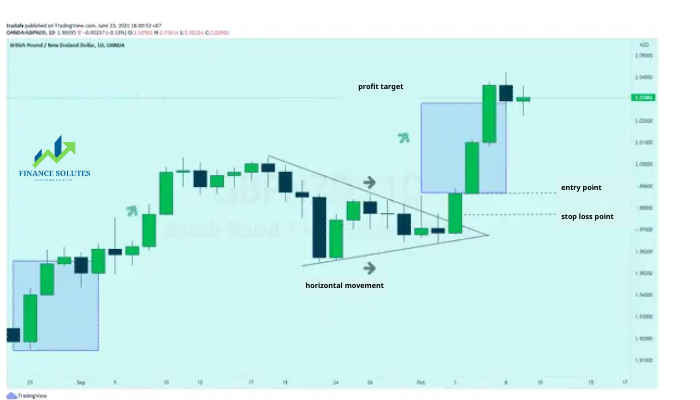
Traders should enter a trade when a breakout is confirmed after a sudden price movement. This pattern, following a strong price move, indicates a high probability of a breakout and a continuation of the original trend.
A candle closing above the pennant provides an entry point. In this example, the breakout is quite significant, reinforcing the likelihood of an upward continuation.
A stop-loss order can be placed at the lowest point of the breakout candle, indicating a substantial move. For more cautious traders, a stop-loss can be set below the pennant to minimize downside risk. This generally offers a higher level of protection for traders.
Remember that the market does not always move as expected. That’s why traders must always apply prudent risk management. To mitigate risk, only trade with capital you can afford to lose.
To set a profit target, traders can measure the distance from the start of the flagpole to the Pennant pattern and then double this distance from the breakout price point of the Pennant pattern.
- t.me/finance_solutes
- Website: https://finance-solutes.com
- Hotline: +1 929 5636 439 ( Hotline )
- 26 Broadway, Suite 934, New York, 10004, US
