
 XM
XM Bybit
Bybit Binance
 Robinhood
 Webull
 IC Markets
 Pepperstone
 OKX
OKX Vantage
 VT Markets
 BingX
BingX Gate.io
 Kucoin
 MEXC
MEXC Exness
 Bitget
Reversal price patterns are essential for any trader to understand, even for professional traders. These patterns frequently repeat and help us capture price fluctuations at a given time. Therefore, in today’s article, Finance Solutes will introduce you to the most powerful trend reversal patterns in the Forex market.
Let’s get started!!!
1. WHAT ARE TREND REVERSAL PRICE PATTERNS?
Reversal price patterns are patterns that signal a trend reversal. A rising price trend will shift to a decline, and vice versa, a declining price trend will reverse to an uptrend.
These patterns are commonly used in trending markets and are relatively easy to identify on charts. However, traders often recognize them only after they have already occurred.
Below are some common reversal price patterns in Forex trading:
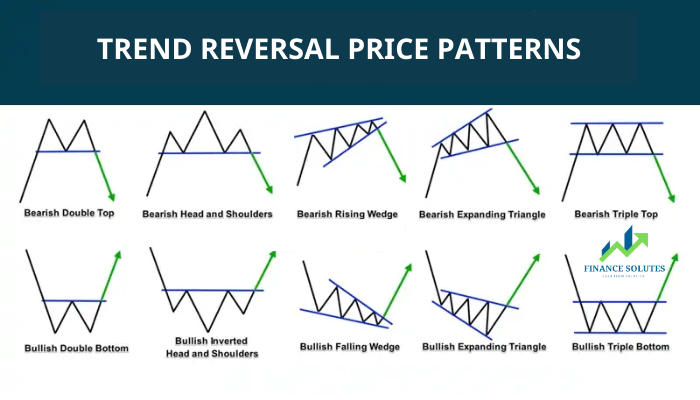
2. THE MOST POWERFUL TREND REVERSAL PRICE PATTERNS
2.1. Head and Shoulders Pattern
This pattern comes in two forms: the Head and Shoulders pattern and the Inverted Head and Shoulders pattern.
Head and Shoulders Pattern
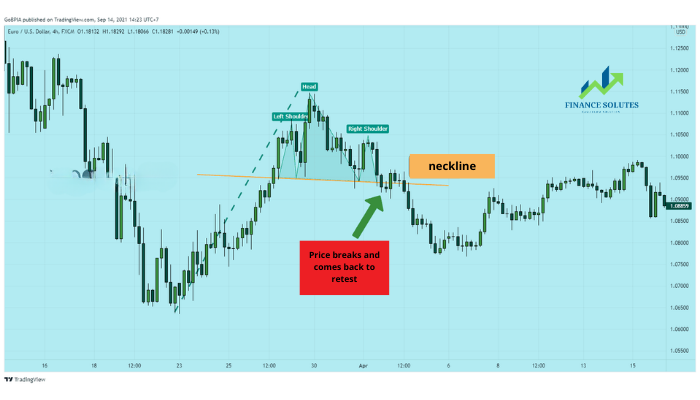
In an uptrend, the Head and Shoulders pattern appears, signaling a trend reversal to a downtrend.

And here is an actual image of the pattern appearing on the price chart:
Inverted Head and Shoulders Pattern
In a downtrend, the Inverted Head and Shoulders pattern appears and the downtrend reverses to an uptrend.

And here is an actual image of the pattern appearing on the price chart:
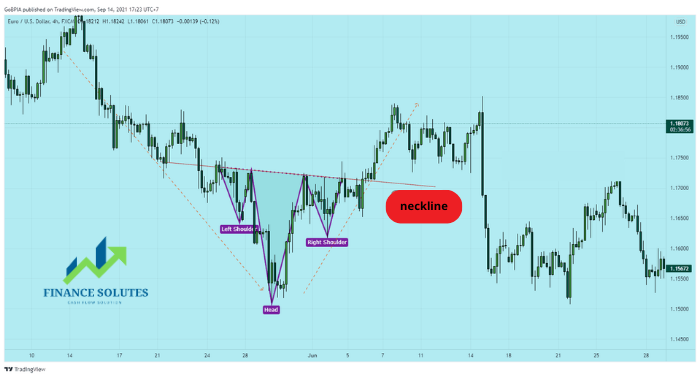
As you can see in the two patterns that TradaFX has just shared, they both feature a key line known as the Neckline. In the standard Head and Shoulders pattern, this line acts as a support level. Conversely, in the Inverted Head and Shoulders pattern, it becomes a resistance level.
When the Head and Shoulders pattern is formed, the price breaks through the Neckline and then retests it before confirming the breakout. At this point, the probability of the price reversing its previous trend is high. Therefore, the ideal time to execute a BUY/SELL order is when the price touches the Neckline for the final time.
2.2. Double Top – Double Bottom Pattern
Double Top Pattern
In an uptrend, the Double Top pattern appears, signaling a trend reversal to a downtrend.
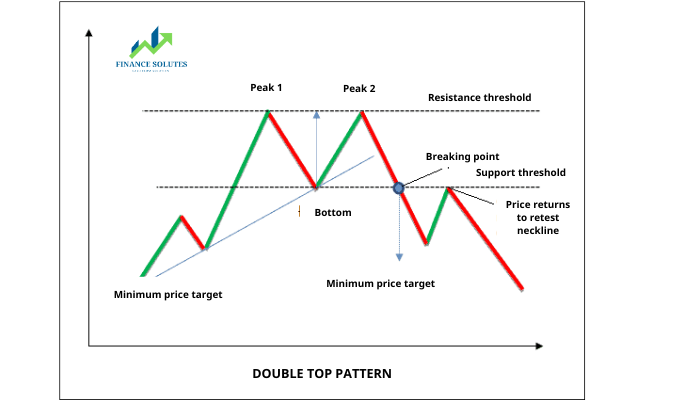
And here is a real example of a Double Top pattern appearing on a price chart:
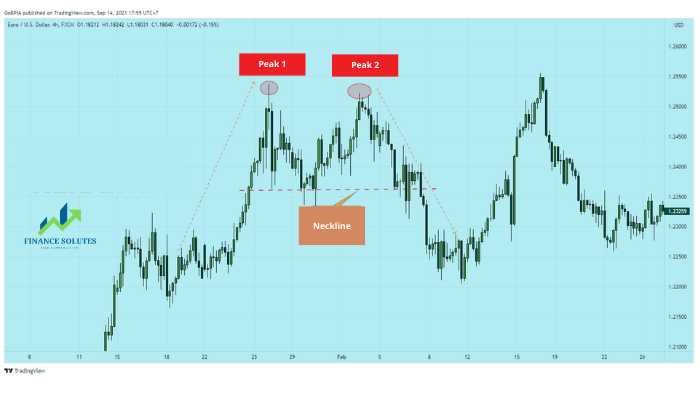
Double Bottom Pattern
In a downtrend, a Double Bottom pattern appears and the trend reverses to an uptrend.
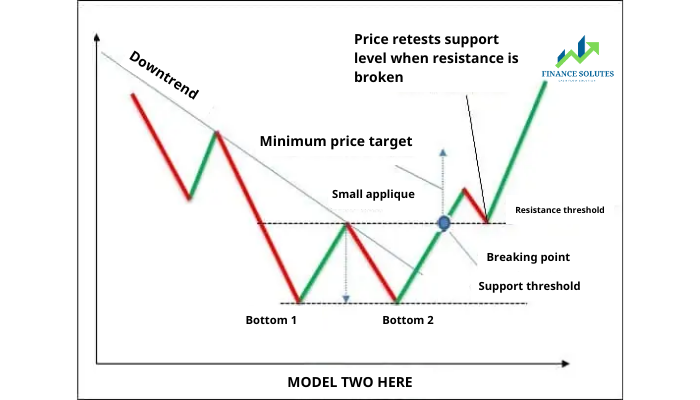
Let’s look at a real image of the Double Bottom pattern appearing on the price chart:
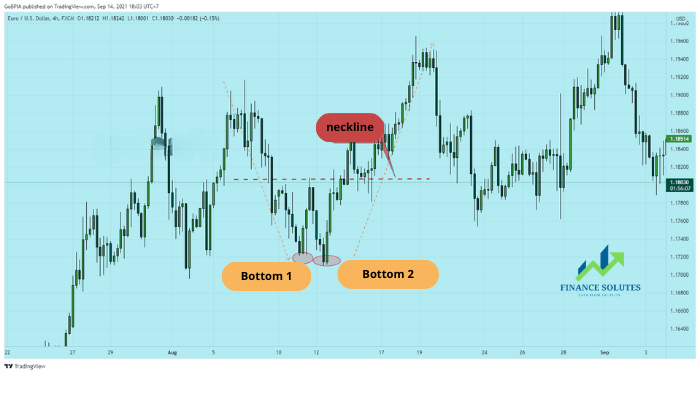
From the real image of the Double Bottom Double Top pattern, you can see that to trade effectively with this pattern, you need to wait patiently until the price breaks the neckline (which is the support or resistance level) before entering an order. Execute a SELL order when the price breaks the support level of the Double Top pattern; and execute a BUY order when the price breaks the resistance level of the Double Bottom pattern.
2.3. Triple Top – Triple Bottom Pattern
Triple Top Pattern
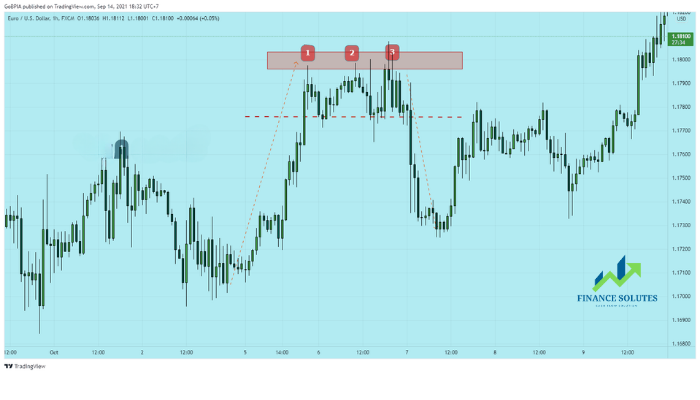
In an uptrend, the Triple Top pattern appears, signaling a trend reversal to a downtrend.
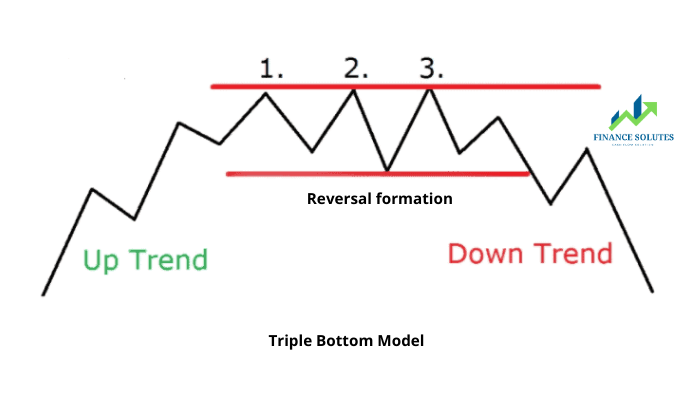
Real life example of Triple Top pattern on forex chart:
Triple Bottom Pattern
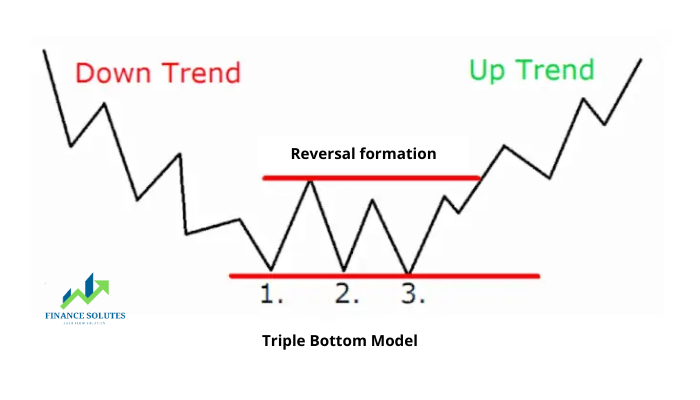
In a downtrend, a Triple Bottom pattern appears and the trend reverses from down to up
And here is the actual image you can see on your price chart:
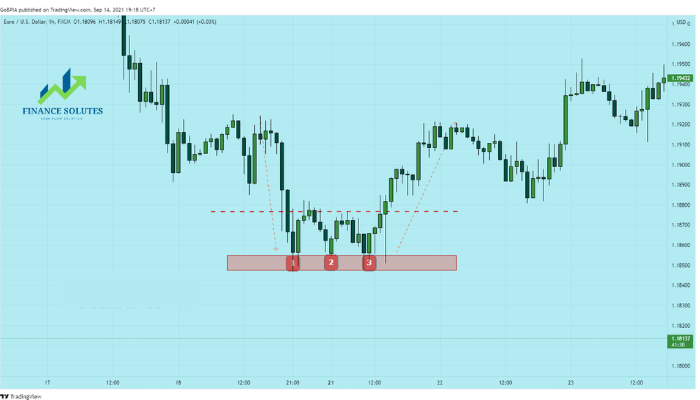
The Triple Top – Triple Bottom pattern is also a trend reversal pattern, similar to the Double Top – Double Bottom pattern. In fact, it can be considered a failed version of the Double Top – Double Bottom. This pattern often results from a failed breakout of the support/resistance levels in the Double Top – Double Bottom pattern. When this happens, the market continues moving and forms a new peak or trough before confirming the Neckline breakout.
The trading strategy for this pattern is the same as for the Double Top – Double Bottom:
- Execute a SELL order when the price breaks the support level of the Triple Top pattern.
- Execute a BUY order when the price breaks the resistance level of the Triple Bottom pattern.
2.4. Rectangle Pattern
As mentioned earlier, if the Triple Top – Triple Bottom pattern forms due to failed breakouts of the support/resistance levels in the Double Top – Double Bottom pattern, then the Rectangle pattern represents a continued failure to break these levels.
In this case, the price moves sideways for an extended period, repeatedly hitting and rebounding from the support and resistance levels. This sideways movement eventually forms the Rectangle pattern.
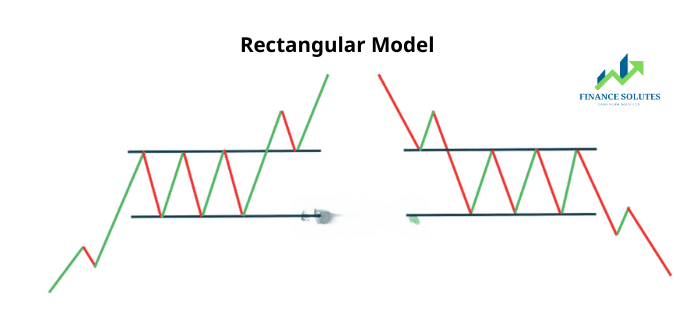
Real life example of rectangle pattern on forex chart:
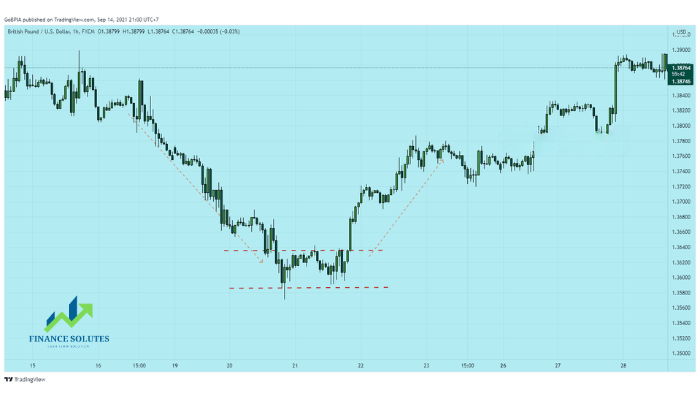
Similar to the Double Top – Double Bottom, Triple Top – Triple Bottom patterns; you should patiently wait for the price to break out. Execute a SELL order when the price breaks support, BUY when it breaks resistance.
3. SUMMARY
Thus, through today’s article, Finance Solutes has shared with you the most powerful price reversal patterns in forex trading. Hopefully, with the forex trading instructions we have just presented, it will help you in some way in the process of trading and investing in Forex.
Wish you success in your trading career!!!
- t.me/finance_solutes
- Website: https://finance-solutes.com
- Hotline: +1 929 5636 439 ( Hotline )
- 26 Broadway, Suite 934, New York, 10004, US
