
 XM
XM Bybit
Bybit Binance
 Robinhood
 Webull
 IC Markets
 Pepperstone
 OKX
OKX Vantage
 VT Markets
 BingX
BingX Gate.io
 Kucoin
 MEXC
MEXC Exness
 Bitget
In previous articles, Finance Solutes has guided you on how to use the Fibonacci Retracement and Fibonacci Extension tools in forex trading. Today, we will continue introducing you to the Fibonacci Arcs tool. So, what is a Fibonacci Arc? How is Fibonacci Arc used in Forex trading? Let’s explore this topic with Finance Solutes in today’s article.
Let’s get started!!!
1. WHAT IS FIBONACCI ARC?
Fibonacci Arc is a technical analysis indicator used to provide potential support/resistance levels for an asset.
1.1. Fibo Arc
Fibonacci Arcs are semicircles extending outward from a line connecting the highest and lowest points in a price trend, known as the baseline. These semicircles intersect the baseline at the ratios of 23.6%, 32.8%, 50%, 61.8%, and 78.6%. Therefore, this tool is based on both price and time, as a longer baseline results in wider arcs, and vice versa.

Fibonacci Arc is often used to connect two important price points, such as a Swing High and a Swing Low. The baseline is drawn by connecting these two points, and then the semicircles will appear — indicating where the price might pull back or bounce off.
1.2. The Nature of Fibonacci Arc
Fibonacci Arc takes both price and time into account when illustrating potential support/resistance zones.
The arcs (semicircles) are formed from the baseline connecting the highest and lowest points. These arcs represent where the price might find support or resistance in the future. After a price increase, the arcs show where the price could retest before continuing its upward movement. Similarly, after a price drop, the arcs indicate where the price might retrace before continuing downward.
The arcs are also considered dynamic support and resistance levels because they shift to different levels over time.
1.3. Distinguishing Fibonacci Arc and Fibonacci Retracement
Fibonacci Retracement corresponds to the intersection points of the Fibonacci Arc’s semicircles with the baseline. If you draw both the Fibonacci Retracement and Fibonacci Arc tools using the same baseline, the retracement levels will align with the points where the arcs intersect the baseline. For example, both 23.6% levels will be at the same price on the chart.
Fibonacci Retracement consists of horizontal levels, meaning they are fixed over time. On the other hand, the arcs of the Fibonacci Arc intersect the baseline only once. For different timeframes, they will shift based on the arc’s radius.
Therefore, retracement levels are static, while arc levels are dynamic.
2. HOW TO USE FIBONACCI ARC IN FOREX
Now, Finance Solutes will guide you on how to draw the Fibonacci Arc tool on TradingView. To do this, make sure you have registered an account on this trading platform.
2.1. How to Draw Fibonacci Arc
Open TradingView, go to the Chart interface, look at the toolbar on the left side of the screen, select Gann and Fibonacci Tools; then choose Fibonacci Arcs.
You’ve now successfully added this tool to your trading platform. Let’s move on to drawing the Fibonacci Arc on a real forex chart.
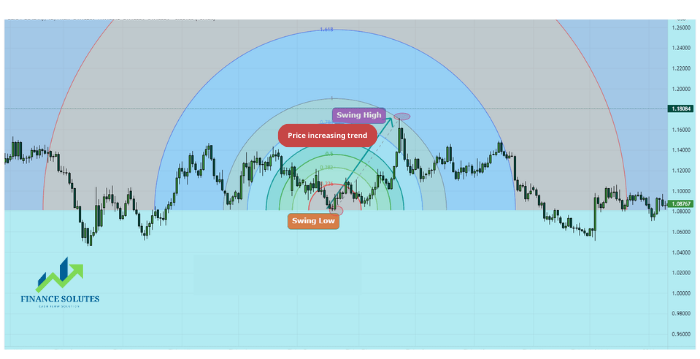
In an uptrend — within the chosen trading timeframe, drag the Fibonacci Arc tool from the lowest point (Swing Low) to the highest point (Swing High), then release the mouse. At this point, you’ll see the results. The support zones (Support) are at the 38.2%, 50%, and 61.8% levels. Here is a real example on a forex chart:
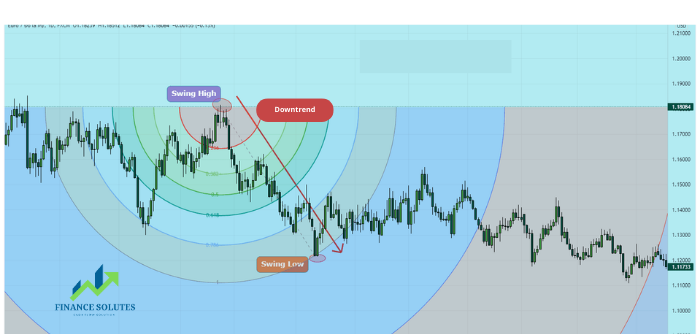
In a downtrend — within the chosen trading timeframe, drag the Fibonacci Arc tool from the highest point (Swing High) to the lowest point (Swing Low), then release the mouse. At this point, you’ll see the results. The resistance zones (Resistance) are at the 38.2%, 50%, and 61.8% levels. Here is a real example on a forex chart:
2.2. How to Calculate Fibonacci Arc
Predict support/resistance levels as the price approaches the Fibonacci Arc.
Fibonacci Arc Formula:
- Baseline: A line from point A to point B
- First Arc: Radius = 23.6% of the baseline
- Second Arc: Radius = 38.2% of the baseline
- Third Arc: Radius = 50% of the baseline
- Fourth Arc: Radius = 61.8% of the baseline
2.3. How to Trade with Fibonacci Arc on a Forex Chart
Now that you know how to draw the Fibonacci Arc tool on a forex chart, let’s dive into how to trade with this tool with TradaFX.
To trade effectively with Fibonacci Arcs, we need to combine them with the Fibonacci Retracement tool, as this combination provides more accurate and valuable signals.
The theoretical basis of this trading strategy is as follows: When the resistance level of the Fibonacci Retracement aligns with the arc of the Fibonacci Arc, it forms a strong resistance level where the price may reverse.
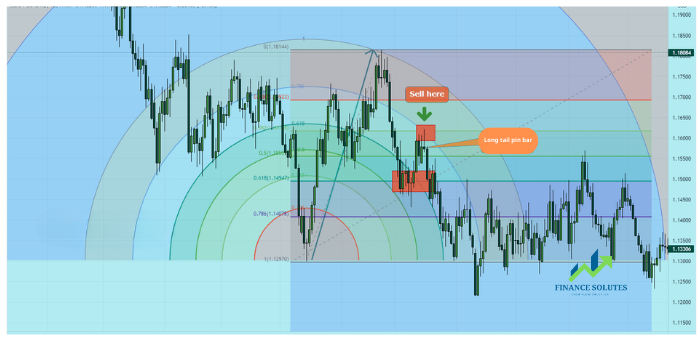
A key strength of the Fibonacci Arc tool is that when the arc slopes downward, it can serve as an effective “timing” mechanism for the market. Let’s observe an example below:
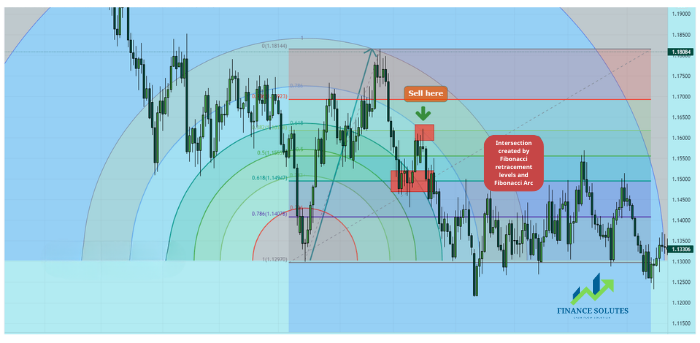
In the example above, Finance Solutes drew the Fibonacci Arc for the previous uptrend to identify the stopping points for the next retracement.
The strategy is outlined as follows. The overall market trend is still downward — although the selling pressure has weakened, Finance Solutes advises prioritizing finding SELL opportunities.
So, you draw the Fibonacci Arc for the previous uptrend to find a reasonable SELL entry when a retracement occurs.
In the real example above, we have two potential entry points:
-
First Intersection: Between the 0.618 Fibonacci Retracement and the 0.618 Fibonacci Arc. These are two strong resistance levels. Therefore, this zone will effectively resist the price.
-
Second Intersection: Between the 0.382 Fibonacci Retracement and the 0.786 Fibonacci Arc. The upward retracement wave stopped here. This is the signal for traders to enter a SELL order.
-
Confirmation Signal: The appearance of a long-tailed Pin Bar confirms that the price has rejected this resistance level, indicating that buying pressure has dried up. Therefore, you can confidently execute the SELL order.
3. LIMITATIONS OF USING THE FIBONACCI ARC
Fibonacci Arcs highlight areas of potential support and resistance; however, there is no guarantee that the price will stop or reverse at these levels. Additionally, since there are multiple arcs, it’s unclear which arc will provide support/resistance (if any).
Fibonacci Arcs are often combined with other forms of technical analysis, such as chart patterns and technical indicators. For example, traders may use Fibonacci Arcs to identify potential support and resistance areas but wait for the price to pause and then start reversing from these levels (moving back in the direction of the trend) before executing trades in line with the trend direction.
4. SUMMARY
In today’s article, Finance Solutes has shared forex knowledge about the concept, significance, drawing methods, and trading strategies using the Fibonacci Arc tool in forex charts. We hope that what we’ve presented will be helpful to you in your trading and forex investment journey.
Wishing you success in your trading career!!!
- t.me/finance_solutes
- Website: https://finance-solutes.com
- Hotline: +1 929 5636 439 ( Hotline )
- 26 Broadway, Suite 934, New York, 10004, US
