
 XM
XM Bybit
Bybit Binance
 Robinhood
 Webull
 IC Markets
 Pepperstone
 OKX
OKX Vantage
 VT Markets
 BingX
BingX Gate.io
 Kucoin
 MEXC
MEXC Exness
 Bitget
Three Black Crows Candlestick Pattern or the Three Black Crows has been mentioned in the article about the Three White Soldiers pattern. The Three Black Crows pattern is considered the inverse version of the Three White Soldiers pattern. So, what is the Three Black Crows pattern? And does this pattern have any limitations?
1. WHAT IS THE THREE BLACK CROWS CANDLESTICK PATTERN?
The Three Black Crows candlestick pattern is a bearish pattern that can predict the reversal of a bullish market trend. This pattern is formed by three consecutive bearish candles. Similar to the Three White Soldiers pattern, the size of the candles and their wicks are used to assess whether the price is experiencing a pullback or if it has truly reversed.
This is a bearish Japanese candlestick reversal pattern, so it should only be considered when it appears after an uptrend. Visually, it looks like three descending steps. It is named Three Black Crows because the bearish candles often appear black when traders set candle colors in platforms like MT4. Many traders are more familiar with red bearish candles than black ones.
1.1. How to Identify the Three Black Crows Pattern?
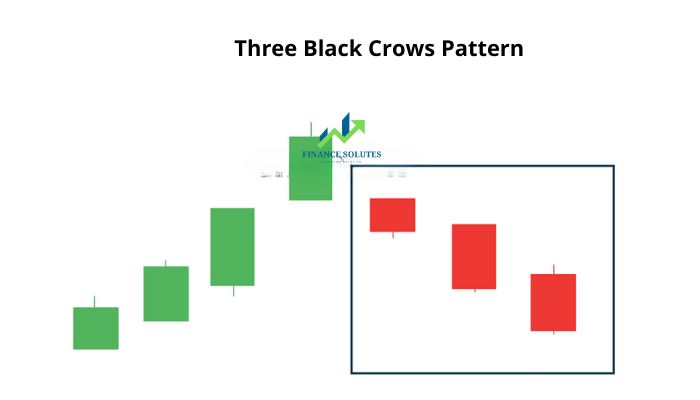
In contrast to the Three White Soldiers pattern, the Three Black Crows consists of three consecutive bearish candles. Each red candle has a lower opening and closing price than the previous red candle. The closing price should be close to the session’s lowest price — in other words, the lower wick (shadow) is small or non-existent.
Ideally, each candle opens within the body of the previous candle. This creates a slight upward gap before forming the next bearish candle.
Below is a visual illustration of the Three Black Crows pattern:
1.2. The Meaning of the Three Black Crows Pattern
When the market is in an uptrend, the formation of a Three Black Crows pattern confirms the strength of the sellers. This pattern can signal a strong reversal in price action from an uptrend to a downtrend on the chart.
As the Three Black Crows pattern emerges, the bulls open the trading session at a slightly higher price than the previous close, but the price is pushed lower throughout the session. Eventually, under pressure from the bears, the price closes near the session’s lowest point.
Some traders may spot similar patterns using intraday charts, but daily charts are considered the most reliable. It’s crucial for traders to monitor the length of the second and third candles. These candles should ideally be of equal size (or larger) to indicate that the bears have taken full control.
2. COMPARE THREE BLACK CROWS AND 3 SOLDIERS CANDLESTICK PATTERN
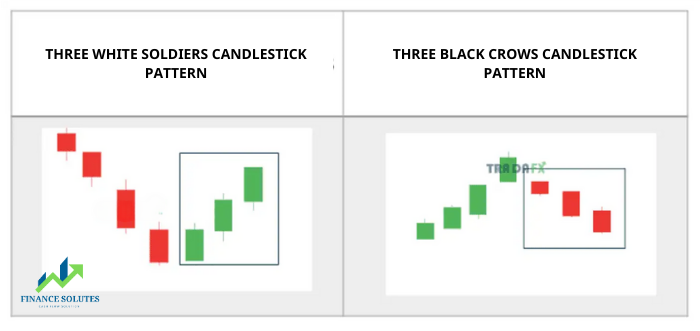
The Three Black Crows pattern is the opposite of the Three White Soldiers pattern. The Three Black Crows pattern occurs at the end of an uptrend and predicts a potential price reversal to the downside.
The Three White Soldiers Pattern appears as three consecutive bullish candles, typically white (or green), with long bodies and short wicks — ideally, no wicks at all. The opening price occurs within the previous candle’s body, and the closing price occurs above the previous candle’s close.
The Three White Soldiers pattern, simply put, signals a reversal from a downtrend to an uptrend, while the Three Black Crows pattern indicates a reversal from an uptrend to a downtrend.
3. HOW TO TRADE THE THREE BLACK CROWS PATTERN
The reliability of the Three Black Crows pattern depends significantly on where the pattern forms. Ideally, the Three Black Crows should consist of bearish candles with relatively long bodies, closing at or near the session’s lowest price.
Trading volume can also enhance the accuracy of this reversal pattern. In an ongoing uptrend, trading volume is usually quite low. However, when the Three Black Crows pattern forms, trading volume tends to spike during these sessions. This situation can be explained by the uptrend being driven by a small group of bullish traders, followed by a reversal caused by a larger group of bearish traders.
Below is a real-life example of the Three Black Crows pattern.
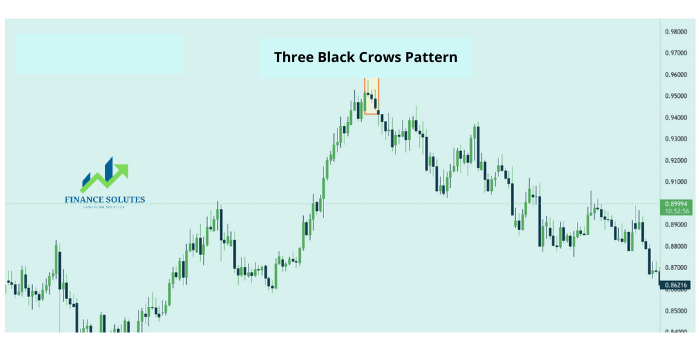
Traders typically enter the trade when the third candle closes. The stop-loss level can be set above the recent high or at the high of the first candle in the Three Black Crows pattern.
The take-profit level varies depending on each trader’s expectations. A useful tip is to switch to the weekly chart to identify significant historical levels that may act as support or resistance. Generally, you can combine this pattern with other technical analysis tools to pinpoint key data points.
4. CONCLUSION
In life, black crows are often seen as an omen of bad luck. In trading, the Three Black Crows pattern gets its name because its formation signals the end of an uptrend. It indicates that after a period of bullish control, the uptrend has weakened, and the bears are taking over.
However, like other candlestick formations, the Three Black Crows pattern has its limitations. Therefore, traders should use it alongside other technical indicators and chart patterns to confirm reversals. When trading, don’t forget to set a stop-loss to protect your account!
- t.me/finance_solutes
- Website: https://finance-solutes.com
- Hotline: +1 929 5636 439 ( Hotline )
- 26 Broadway, Suite 934, New York, 10004, US
