
 XM
XM Bybit
Bybit Binance
 Robinhood
 Webull
 IC Markets
 Pepperstone
 OKX
OKX Vantage
 VT Markets
 BingX
BingX Gate.io
 Kucoin
 MEXC
MEXC Exness
 Bitget
Forex Trends: An Indispensable Term for Technical Analysis Traders. Forex trends are an indispensable term for traders who follow the technical analysis school. They provide traders with the most comprehensive view of the market.
So, what exactly is a trend? How do you identify forex market trends? How is market structure determined? Let’s dive into the article below to gain a deeper understanding of market trends!
1. WHAT IS A TREND?
A trend is the inclination toward a particular direction. In financial markets, a market trend refers to the direction in which the price of an asset moves over a certain period. Market trends can occur in the long term, short term, or medium term.
In the forex market, a trend happens when the price of a currency pair moves in a clearly identifiable direction over a specific period.

There is no specific timeframe that defines a trend or how long it may last. In the forex market, a trend occurs when the price of a currency pair moves in a clearly identifiable direction over a certain period. Forex trends are an essential concept in technical analysis, providing insights into the overall direction of the market. Generally, the length of a trend depends on economic conditions, market sentiment, and various other factors.
2. THREE TYPES OF TRENDS IN THE FOREX MARKET
Essentially, trends reflect the average value of prices over time. Trends exist across all timeframes and in every market. In the forex market, trends are typically classified into three types: uptrend, downtrend, and sideways trend.
2.1. Uptrend
An uptrend occurs when prices continuously create higher highs and higher lows. In this case, the trendline connects the price peaks on the chart, acting as a resistance level.
A simple yet effective way to identify market trends is to apply trend-following strategies. A bullish market is one that is in an uptrend. The trendline connecting the highs and lows during an uptrend typically slopes upward, indicating that traders in the market are operating with an optimistic mindset.
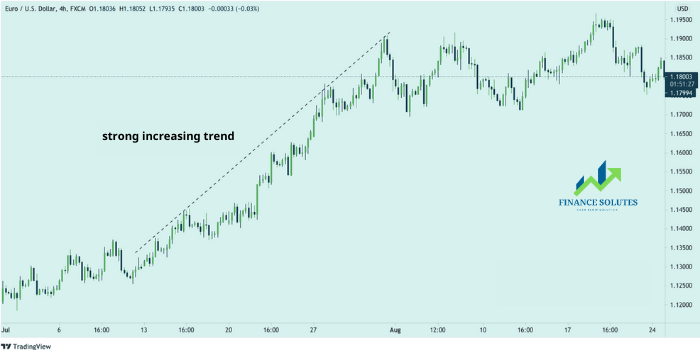
A trendline that connects at least two rising lows in an uptrend is considered a support level. When the price breaks below this trendline, it signals a potential weakening of the trend and the possibility of a reversal.
2.2. Downtrend
In contrast to an uptrend, a downtrend is formed when prices continuously create lower highs and lower lows. The trendline connecting the descending peaks in a downtrend acts as a resistance level. Similar to an uptrend, when a trendline connects at least two falling highs or lows, the market can be considered to be in a downtrend.
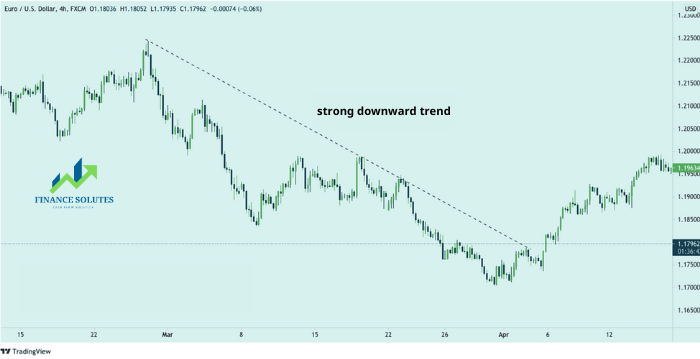
A bearish market is one where prices tend to move downward. The trendline in a bearish market typically slopes downward. In a downtrend, traders expect that when the price touches the trendline or the key resistance level, it will bounce back down and continue to drop. Conversely, when the price breaks above the trendline, it signals that the trend is weakening and a reversal may be imminent.
2.3. Sideways Trend
There are periods when traders notice that prices are neither in an uptrend nor a downtrend. In such cases, the market is said to be in a sideways trend. Many traders also refer to this as a range-bound market or price consolidation.
Sideways movement indicates market indecision; neither buyers nor sellers have enough strength to push prices higher or lower. This creates a phase where prices fluctuate within a certain range, known as the accumulation phase.
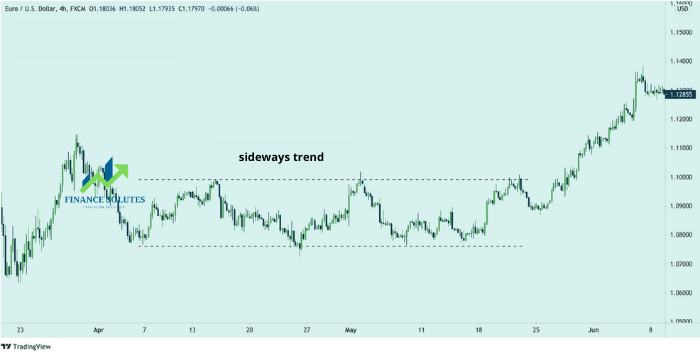
In this case, traders can wait for the price to break above or below the trendline and trade in the direction of the breakout. The longer the accumulation phase, the stronger the following trend is likely to be.
Additionally, market trends can also be classified based on the time they persist.
Every trend consists of movements in the direction of the trend, interrupted by counter-trend movements known as “retracements” or “corrections”. A trend is expected to continue until a reversal occurs, changing the trend’s direction.
3. MARKET TREND STRUCTURE
In the market, prices often follow a certain trend, then enter an accumulation phase or reverse. The market transitions from a clear trend into sideways movement or shifts into another distinct trend. Below are the key phases that form the structure of market trends, which traders need to understand.
3.1. Accumulation Phase
The accumulation phase usually appears at the end of a strong downtrend. When the market hits bottom and currency pairs experience a sharp decline, prices tend to move sideways within a range after the downtrend ends.
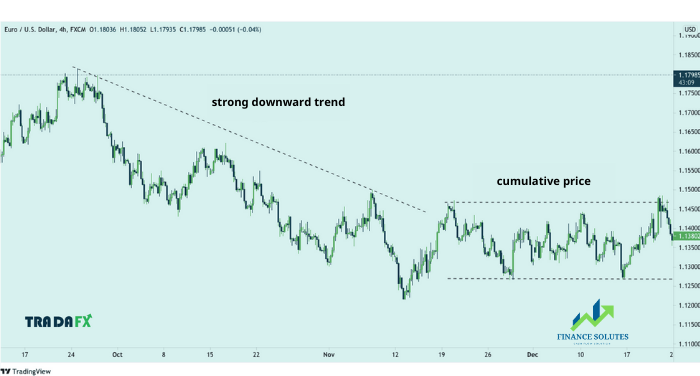
This phase can last for several weeks or even months, during which prices remain within a range, reflecting a balance between buyers (bulls) and sellers (bears).
During the accumulation phase, traders should adopt a range-trading strategy rather than forcing trades in the direction of a trend.
3.2. Growth or Decline Phase
The growth phase occurs when the market price breaks above the upper trendline of the sideways trend. At this point, prices no longer move sideways but start to rise gradually.
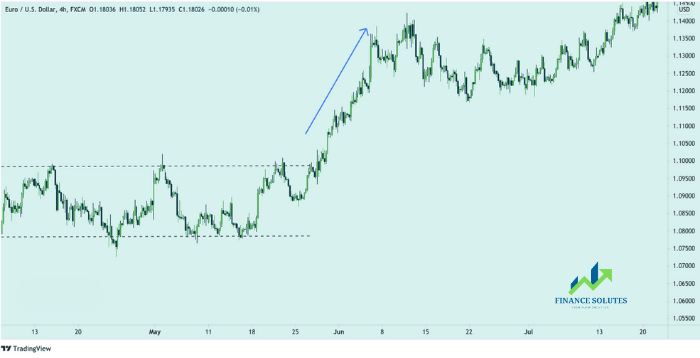
Conversely, after a period of sideways movement, prices may enter a decline phase. In this case, the market forms progressively lower highs and lower lows, signaling a downward trend.
Traders can take advantage of the growth phase by riding the uptrend as long as it lasts. Technical traders often apply trend-following strategies, buying at each higher low in the uptrend.
As in the previous example, after a period of sideways movement within a price channel or range, the price breaks above that range and continues to rise sharply. This phase is known as the growth phase.
3.3. Distribution Phase
Similar to the accumulation phase, the distribution phase occurs after the market has been in an uptrend for a long period. However, unlike accumulation, the distribution phase happens after an uptrend.
Continuing with the earlier growth phase example: after a strong upward movement, the price eventually returns to a range and moves sideways again. This marks the beginning of the distribution phase.
During the distribution and accumulation phases, traders often tend to buy at support and sell at resistance.
3.4. Continuation or Reversal Phase
After the distribution or accumulation phase, prices can either continue the previous long-term trend or reverse into the opposite trend.
Following the earlier example, after breaking out of the range, the price tends to continue the previous long-term trend. However, there are times when the price reverses into a downtrend. Therefore, it is crucial for traders to be cautious during the distribution phase, as the price can either break out in the direction of the underlying uptrend or reverse and start moving in the opposite direction.
4. TOP INDICATORS FOR IDENTIFYING MARKET TRENDS
Tracking trends in forex is one of the most popular methods to identify trading opportunities in the forex market. Trends take considerable time to form and require multiple factors to trigger a change.

In the forex market, traders often prefer trend-following strategies. These strategies can be designed in various ways using different technical indicators, such as identifying trends with moving averages (MA).
So, if you are a forex trend trader, continue reading to discover the top indicators for identifying market trends here: Trend Indicators.
5. SUMMARY
Through this article, Finance Solutes hopes you now have a clear answer to the question: What is a market trend? Additionally, you should now understand how to identify forex market trends.
Moreover, having an in-depth understanding of market structure gives traders a significant advantage over others. Besides using trendlines, traders can also leverage trend indicators to determine market trends effectively. TradaFX will continue this series with an in-depth guide on the top trend indicators, so stay tuned!
- t.me/finance_solutes
- Website: https://finance-solutes.com
- Hotline: +1 929 5636 439 ( Hotline )
- 26 Broadway, Suite 934, New York, 10004, US
