
 XM
XM Bybit
Bybit Binance
 Robinhood
 Webull
 IC Markets
 Pepperstone
 OKX
OKX Vantage
 VT Markets
 BingX
BingX Gate.io
 Kucoin
 MEXC
MEXC Exness
 Bitget
Trading Based on IG Client Sentiment (IGCS) Data Can Help Traders Identify Potential Market Trends That May Not Be Obvious to New Forex Market Participants
A successful sentiment-based trading strategy seeks to trade in the opposite direction of the FOMO-driven crowd sentiment. This approach highlights a stronger directional bias. While it may seem counterintuitive, it has a solid foundation and is explained in this article.
1. WHAT IS IG CLIENT SENTIMENT?
IG Client Sentiment (IGCS) utilizes data from retail IG traders with actual positions. Essentially, traders can see the positioning of the majority of other traders—whether they are buying or selling—when analyzing trades. Moreover, traders can access IG Client Sentiment data through an interactive tool, allowing them to filter different asset types and markets accordingly.

All of this is made possible by IG’s real-time and accurate data on the most frequently traded markets. This data can be utilized in any sentiment-based trading strategy.
It is important to note that traders should not trade solely based on IG Client Sentiment. Instead, sentiment analysis should be combined with technical analysis, and proper position sizing (relative to account size) should always be maintained.
2. WHY IS CLIENT SENTIMENT A CONTRARIAN INDICATOR?
Before implementing a sentiment-based trading strategy, it is crucial to understand why client sentiment is considered a contrarian signal. IG Client Sentiment is viewed as a contrarian indicator for two main reasons.
2.1. Trading Against the Trend
The majority of retail traders (who contribute to IGCS data) tend to trade against trends. Unfortunately, this behavior appears to be more instinctive than logical, as it continues to persist.
These traders attempt to catch market tops and bottoms by trading reversals in strongly trending markets. This approach contradicts the fundamental principle that “the trend is your friend.”
2.2. Exiting Positions
If the market is in an uptrend and short-selling sentiment dominates, all those short traders will eventually need to do the opposite to close their positions—this means buying to close. Whether due to stop-losses being triggered or manual trade exits, this buying activity will push prices higher.
If sellers significantly outnumber buyers, those sellers will ultimately have to buy to exit their positions, creating strong buying momentum. This benefits traders who are in long positions but works against those who are short.
3. SENTIMENT TRADING STRATEGY WITH IGCS
This section expands on IGCS by integrating it into a sentiment-based trading strategy. The key steps involved are outlined below:
– Use IG Client Sentiment to establish the market and direction of the trade – Is the market ranging or trending? – Overlay buy/sell positions on the price chart to see the big picture
3.1. Using IG Client Sentiment to Establish Market Conditions and Trade Direction
Traders can consider sentiment analysis at the beginning of their analysis process, alongside thorough technical and/or fundamental analysis. Additionally, checking client sentiment can serve as a confirmation for trade decisions.
Using client sentiment as a starting point can be highly beneficial because it indicates which markets to trade and in which direction—before conducting any further analysis. Traders can then use technical analysis to pinpoint optimal entry and exit points.
Establishing Market Conditions and Direction: Look for markets where positioning is at extreme levels. A strong uptrend (downtrend) combined with excessive short (long) positioning leads to a bullish (bearish) signal.
Using IG Client Sentiment for Clear Direction:
The IG Client Sentiment summary table shows the number of traders holding long positions in a selected market versus those holding short positions in the same market.
Traders should pay attention to key levels (overbought/oversold) when analyzing sentiment, as these are where the tool provides clearer signals. As shown in the image below, a relatively significant figure of 78% appears for the NZD/USD pair. The index is represented in blue (indicating long positions), and the horizontal bar illustrates the sentiment imbalance in favor of buyers.
Red indicators represent short positions in a currency pair, while blue indicators show long positions in the same pair. Another way to assess sentiment strength is by analyzing the ratio of buyers to sellers. Typically, a ratio greater than 2 indicates a strong retail trader bias, as this means at least 66.6% of traders are either buying or selling.
For example, with 78% of traders net-long NZD/USD, this means that for every one trader holding a short position, 3.54 traders are holding long positions—a significant imbalance in positioning for this currency pair.
Common Trading Signals from IG Client Sentiment:
| Trend Direction | Uptrend | Downtrend | Uptrend | Downtrend |
|---|---|---|---|---|
| Buy/Sell Ratio | < -2 | > +2 | > +2 | < -2 |
| Signal | Buy | Sell | Both Buy & Sell | Both Buy & Sell |
At this stage, we have identified which markets to trade and in which direction, but additional factors need to be considered, which will be explored in the rest of this article.
3.2. Is the Market Ranging or Trending?
Trending Market: Human nature tends to seek bargains, which is why retail traders often try to “call the bounce”—selling in an uptrend and buying in a downtrend.
Ranging Market: In well-established range-bound markets, low volatility conditions make selling at resistance and buying at support the most logical approach.
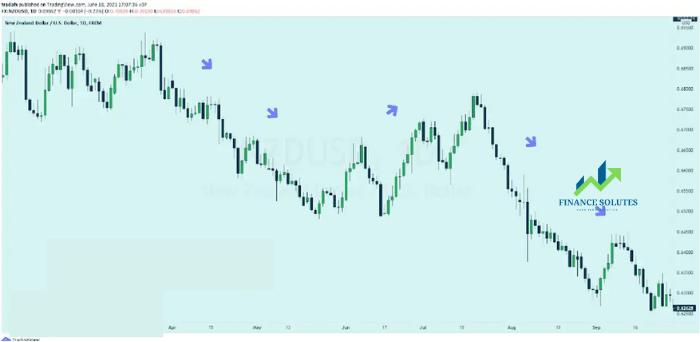
Returning to the NZD/USD example, after identifying that the majority of traders are buying NZD/USD, one could reasonably assume that this presents an ideal contrarian trade setup.
Looking at the NZD/USD chart below, you can clearly see that the overall trend is bearish, despite strong buying activity from retail traders. While this may seem counterintuitive, it reinforces the idea that retail traders often trade against the prevailing trend.
Retail traders tend to focus more on catching reversals in strongly trending markets rather than in range-bound markets, often to their disadvantage. As a result, when trading based on market sentiment, traders will find more reliable contrarian signals in strongly trending markets.
Overlaying Buy/Sell Positions on the Price Chart for a Clearer Picture
To make analysis easier, this article provides a comprehensive report on key markets. This report presents IG Sentiment data with price hidden, allowing traders to better visualize sentiment trends. To access the full report, navigate to the Sentiment page and click the Green Button labeled “IG Client Sentiment Report.”

The report generates price charts for each market, with sentiment data overlaid on the same chart. It also includes a text summary displaying all relevant sentiment metrics before providing traders with a bullish, neutral, or bearish trading outlook.
Buy and Sell Positions
Another valuable but often overlooked feature is tracking changes in buy/sell positions.This feature is particularly useful when recent sentiment shifts are significant and move against the overall market sentiment. Large sentiment shifts like these can indicate a potential reversal in overall market sentiment.
Once the report is open, scroll down to find the desired market. Traders will see a chart along with a quick summary of the most recent overall sentiment data.
At the top of the chart, price movements are displayed as green and red candlesticks. The blue/red sentiment line indicates when traders were buying or selling. If there is a significant gap between the sentiment line and the price line, this can be considered a potential signal to trade in the direction of the trend.

In the chart above, the price is in a strong downtrend, and sentiment data shows that there are more than three sell trades for every buy trade. As a result, this can be considered a bearish signal.
At the bottom of the chart, the actual number of buying and selling traders is displayed. As more traders continue to increase their buy positions, it is no surprise to see the blue line (buy positions) staying above the red line (sell positions) for an extended period.
4. SUMMARY
IG Client Sentiment (IGCS) is a powerful tool, but it does not guarantee perfect predictions. Traders should always incorporate proper risk management strategies in their trades, even when supported by IGCS data.
- t.me/finance_solutes
- Website: https://finance-solutes.com
- Hotline: +1 929 5636 439 ( Hotline )
- 26 Broadway, Suite 934, New York, 10004, US
