
 XM
XM Bybit
Bybit Binance
 Robinhood
 Webull
 IC Markets
 Pepperstone
 OKX
OKX Vantage
 VT Markets
 BingX
BingX Gate.io
 Kucoin
 MEXC
MEXC Exness
 Bitget
The Hammer candlestick pattern is a frequently observed formation in the forex market, providing key insights into trend reversals.
It is crucial for traders to understand that there is more to a hammer candlestick than just spotting it on a chart. Price action and the hammer’s position within the current trend are essential validation factors for this pattern.
1. WHAT IS A HAMMER CANDLE? HOW TO IDENTIFY THE HAMMER CANDLESTICK PATTERN
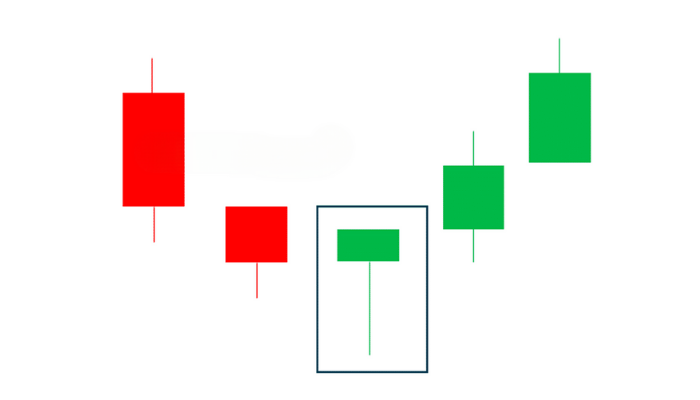
A hammer candlestick is a single candlestick often found at the bottom of a downtrend. It signals a potential bullish reversal in the market. The most common hammer is the bullish hammer, which has a small body and a long lower wick, indicating rejection of lower prices. Another candlestick pattern traders watch for is the inverted hammer, which is an upside-down bullish hammer.
1.1. Bullish Hammer Pattern
The hammer candlestick appears at the bottom of a downtrend and signals a bullish reversal. It has a small body, little to no upper wick, and a long lower wick—resembling a “hammer.” The hammer candlestick suggests that prices initially dropped to a low level, but buying pressure later pushed the closing price higher, hinting at a potential reversal. The extended lower wick of the hammer represents rejection of lower price levels.
1.2. Inverted Hammer Pattern
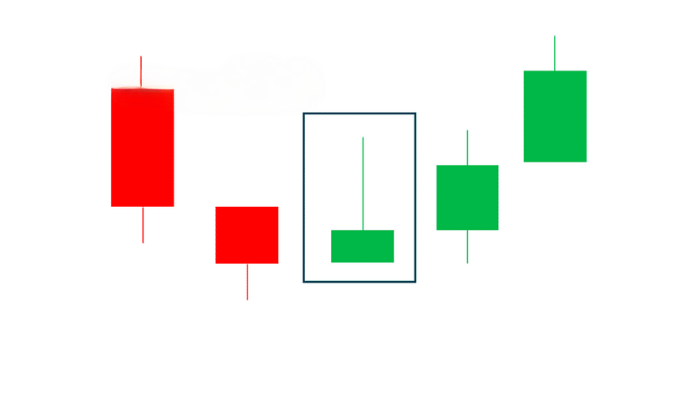
The inverted hammer candlestick pattern also signals a bullish reversal. As its name suggests, it resembles an upside-down hammer. This candlestick has a long upper wick, a small body, and little to no lower wick. The inverted hammer appears at the bottom of a downtrend before buyers (bulls) push the price higher.
This is reflected in the long upper wick, indicating that buyers attempted to drive prices upward. Eventually, the price returns to the opening level, but the closing price remains above the opening price, providing a bullish signal. If buying momentum continues, it will be evident in subsequent price action as the market moves higher.
2. APPLYING THE BULLISH HAMMER PATTERN IN TRADING
The bullish hammer candlestick pattern can be found across various charts and timeframes. Let’s analyze a real example of the hammer candlestick to better understand how to trade it.
Example of a Hammer Candlestick on the AUD/USD Daily Chart:
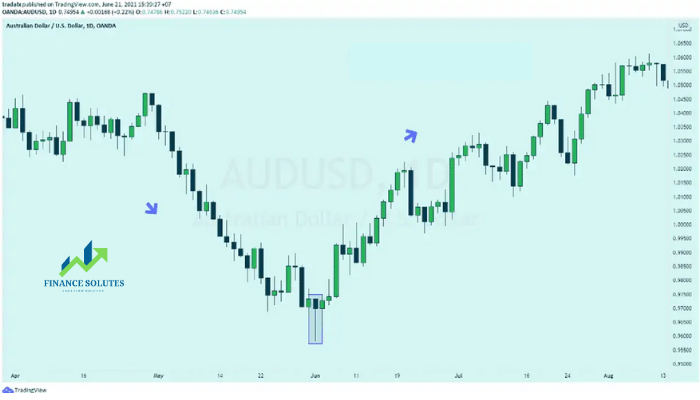
From April 20 to May 31, the AUD/USD pair declined by 892 pips. This downtrend ended with a bullish hammer candlestick, after which the price increased by a total of 792 pips. Traders typically do not rely solely on this candlestick pattern but instead combine it with additional confirmation candles.
This is because the strength of the pattern depends on where it is found. The ideal scenario is when the lower wick of the hammer touches a support level, while the candlestick body closes above the support due to the presence of new buyers. This presents a new buying opportunity. Traders can then place stop-loss orders below the hammer’s wick, specifically under the identified support level.
Beyond the forex market, the hammer candlestick pattern is also applicable in other financial markets. However, stock market analysis requires additional data, such as confirmation candles.
It is important to note that brokers often disclose internal volume figures for various financial markets, including forex. As a result, volume indicators may not be entirely reliable for estimating overall market volume.
The chart below illustrates a bullish hammer candlestick on the NZD/USD chart. Alongside the bullish hammer, there is a subsequent increase in trading volume, as highlighted below. This emphasizes that the trading activity during this phase was driven by high volume—something that retail traders alone would not significantly influence.
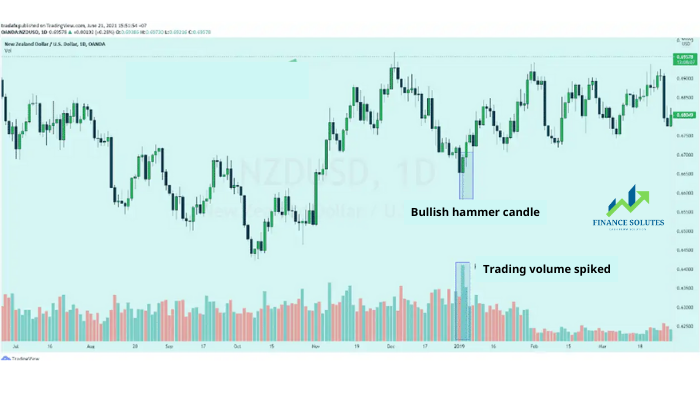
This “rejection” by buyers indicates a refusal of price at that level. This level could be a significant price point where buy orders are triggered. With the combination of a bullish hammer candlestick and trading volume, traders can have some form of confirmation to enter a buy position. As always, risk management principles should be applied to all trades.
3. PROS AND CONS OF THE HAMMER CANDLESTICK PATTERN
| Pros | Cons |
|---|---|
| Reversal Signal: The hammer candlestick indicates rejection of lower prices. In a downtrend, it may signal the end of selling pressure, leading to either sideways movement or a bullish reversal. | No Trend Indication: The hammer candlestick does not provide trend confirmation. Relying solely on the hammer pattern may result in false signals. |
| Exit Signal: Traders with existing short positions may see the hammer as an indication of weakening selling pressure—suggesting an ideal time to close their short trades. | Supporting Evidence Needed: To enter high-probability trades, traders should seek additional supporting information on the chart to confirm price reversals. |
(Supporting evidence can be identified by assessing whether the hammer appears near a key support level, Pivot Point, or significant Fibonacci level, or if an overbought signal is generated on indicators such as CCI, RSI, or Stochastic.)
4. SUMMARY
This article has covered how to identify the hammer candlestick pattern, along with the two most common types found in the market. Hopefully, you have gained a solid understanding of this forex candlestick pattern and can apply the hammer candlestick to your trading strategy. Wishing you luck and success!
- t.me/finance_solutes
- Website: https://finance-solutes.com
- Hotline: +1 929 5636 439 ( Hotline )
- 26 Broadway, Suite 934, New York, 10004, US
