
 XM
XM Bybit
Bybit Binance
 Robinhood
 Webull
 IC Markets
 Pepperstone
 OKX
OKX Vantage
 VT Markets
 BingX
BingX Gate.io
 Kucoin
 MEXC
MEXC Exness
 Bitget
Japanese candlestick patterns are a widely used chart analysis technique among traders. Some traders consider candlestick patterns to be the “holy grail” of their trading strategies, and the Shooting Star pattern is no exception.
Today’s article will introduce you to a pattern that is the opposite of the Inverted Hammer—the Shooting Star candlestick pattern. It is one of the four well-known single candlestick patterns, alongside the Hammer, Inverted Hammer, and Hanging Man. The Shooting Star signals a bearish reversal and frequently appears on price charts.
1. WHAT IS THE SHOOTING STAR CANDLESTICK PATTERN?
The Shooting Star candlestick pattern is a bearish reversal pattern, also known as a “falling star” in some regions. It consists of a single candlestick that forms when the price is pushed higher but is quickly rejected, causing the price to close lower. This rejection results in the Shooting Star having a very long upper wick. The length of the upper wick must be at least twice the size of the candlestick body—see the image below.
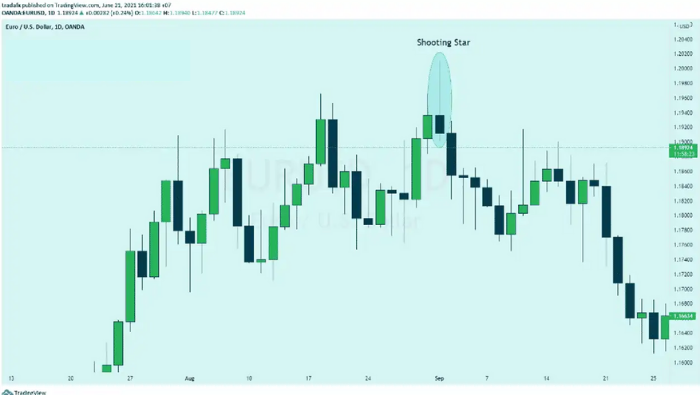
Additionally, the closing price must be near the candle’s lowest price. This creates an overall bearish structure, as the price fails to sustain higher levels.
1.1. Is There a Bullish Version of the Shooting Star?
The bullish counterpart of the Shooting Star pattern is the Inverted Hammer, which appears at the bottom of a downtrend. Another candlestick pattern that resembles and is interpreted similarly to the Shooting Star is the Gravestone Doji—a structure similar to the Inverted Hammer. However, while the Inverted Hammer signals a bullish reversal, the Shooting Star represents a bearish reversal.
Moreover, the Inverted Hammer typically appears at the bottom of a downtrend, near a support level, or during a pullback. Many traders question whether the formation of the Shooting Star differs across markets such as forex, stocks, or commodities. The answer is no—the Shooting Star candlestick pattern provides consistent bearish reversal signals regardless of the financial market it appears in.
1.2. Significance of the Shooting Star Pattern
The Shooting Star pattern signals a potential price reversal. It is most effective when it forms after a series of consecutive bullish candles with higher highs. The pattern can also appear during a general uptrend, even if some recent candles show signs of selling pressure.

Following the Shooting Star candle, there is often a strong intraday rally, indicating the buying pressure observed in previous sessions. However, as the Shooting Star forms, sellers step in and push the price back down toward the opening price, erasing the day’s gains. This suggests that buyers lost control by the end of the session, allowing sellers to potentially take over. The long upper wick represents buyers who entered earlier in the session but are now in a losing position as the price falls back to the opening level.
2. ADVANTAGES AND DISADVANTAGES OF THE SHOOTING STAR IN TECHNICAL ANALYSIS
The Shooting Star pattern is an excellent tool for technical traders, especially new traders, due to its simplicity. Identifying a potential Shooting Star can be a perfect forex trading opportunity if traders follow the pattern’s key characteristics, as explained above.
However, the pattern has some limitations. If a Shooting Star appears near resistance levels or trendlines, it reinforces the bearish reversal signal. However, a single Shooting Star is not always the decisive factor in an overall market trend or movement.
Risk management is essential when trading with the Shooting Star pattern. This provides traders with a safety net in case the market moves unexpectedly.
| Advantages | Disadvantages |
|---|---|
| Easy to identify on charts | Not always reliable for short-selling trades |
| A reliable pattern if all criteria are met | Requires additional confirmation with fundamental or technical analysis |
| Suitable for new traders but not limited to them |
3. TRADING WITH THE SHOOTING STAR
Trading this reversal candlestick pattern is relatively straightforward. First, you anticipate a downward price movement, meaning you want to find entry points for selling. Since the Shooting Star rejects higher prices, you set your stop-loss level near the recent high (as shown by the red horizontal line on the chart).
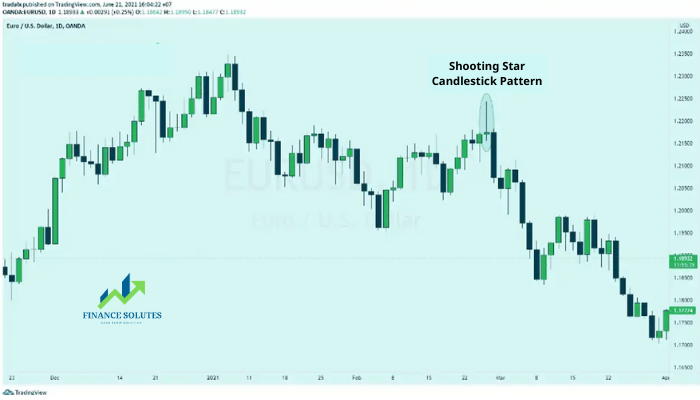
The chart below illustrates the Shooting Star pattern in the EUR/USD pair.
3.1. Entry Points with the Shooting Star Pattern
An experienced trader recognizing this pattern may wait to enter a trade around the midpoint of the candle’s wick rather than immediately after the shooting star forms. This means the trader is initiating a sell trade at a higher price with a tighter stop-loss to minimize risk. Regardless of the entry mechanism, the stop-loss level remains unchanged.
3.2. Take Profit and Stop-Loss Placement for the Shooting Star Pattern
Regarding take profit levels, you should aim for a take profit target at least twice the stop-loss distance. For example, if the stop-loss is 90 pips away from the entry point, look for a minimum potential profit of 180 pips. This aligns with the commonly used risk-to-reward ratio of 1:2, which is consistent with studies on the “Characteristics of Successful Traders.”
4. SUMMARY
In this article, Finance Solutes has introduced the Shooting Star candlestick pattern, also known as the Falling Star. This is a widely recognized candlestick pattern in financial trading, signaling a bearish reversal. It is one of the most valuable reversal patterns with a high probability of success when used correctly.
Hopefully, this article has provided you with insights into a powerful reversal candlestick pattern in financial trading. Traders can further enhance their ability to identify and predict price trends in the market.
Wishing you successful and profitable trading!
- t.me/finance_solutes
- Website: https://finance-solutes.com
- Hotline: +1 929 5636 439 ( Hotline )
- 26 Broadway, Suite 934, New York, 10004, US
