
 XM
XM Bybit
Bybit Binance
 Robinhood
 Webull
 IC Markets
 Pepperstone
 OKX
OKX Vantage
 VT Markets
 BingX
BingX Gate.io
 Kucoin
 MEXC
MEXC Exness
 Bitget
Outside Bar Candlestick Pattern – A Popular Predictive Tool Loved by Traders
So, what is an Outside Bar? What characteristics of this Outside Bar candlestick pattern should traders pay attention to? And how can the Outside Bar pattern be used in trading?
All these questions will be answered in today’s article.
1. WHAT IS THE OUTSIDE BAR CANDLESTICK PATTERN?
The Outside Bar is a Japanese candlestick pattern consisting of two consecutive candles, where the second candle completely engulfs the previous one. This candlestick pattern is easily recognizable on charts and can appear at almost any position.
Looking at the illustration above, you can see that the Outside Bar pattern resembles the Engulfing candlestick pattern.
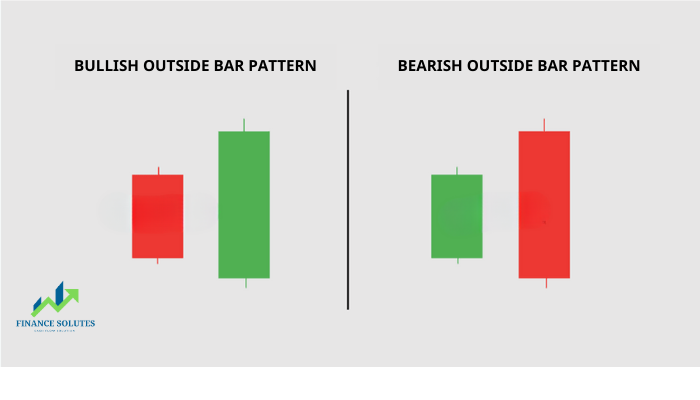
In contrast to the Inside Bar pattern, where the first candle engulfs the second, the Outside Bar pattern features a second candle that completely engulfs the previous one. The first candle in the Outside Bar pattern can sometimes be a Pin Bar.
| Bullish Outside Bar | Bearish Outside Bar |
|---|---|
| In a bullish Outside Bar pattern, the second candle is a bullish (green) candle, while the first candle is a bearish (red) candle. | In a bearish Outside Bar pattern, the first candle is a green bullish candle, followed by a bearish candle. |
Whether it is a bullish Outside Bar (Outside Bar Bullish) or a bearish Outside Bar (Outside Bar Bearish), the second candle in this pattern always engulfs the previous one.
2. IS THE OUTSIDE BAR CANDLESTICK PATTERN THE SAME AS ENGULFING?
How to Differentiate Between Outside Bar and Engulfing – As mentioned above, many traders find the Outside Bar pattern similar to the Engulfing pattern when looking at the illustration. This is because both patterns consist of two consecutive candles, with the second candle engulfing the previous one.
However, in many markets, these two patterns differ in the following ways:
- In the Engulfing pattern, the second candle does not necessarily have to engulf the entire wick of the previous candle.
- In the Outside Bar pattern, the second candle must engulf both the body and the wick of the previous candle.
Additionally, in both cases, the body of the second candle should be significantly larger than the wick of the previous candle. Many traders consider the Outside Bar pattern to be a variation of the Engulfing pattern.
In terms of popularity, the Engulfing pattern is more widely recognized and used by traders.
3. THREE TRADING STRATEGIES WITH OUTSIDE BAR
The Outside Bar candlestick pattern is considered a price action signal in the market. Depending on where the Outside Bar pattern appears, it can provide different signals.
As mentioned earlier, the Outside Bar pattern frequently appears on forex charts. However, this does not mean that every occurrence is a trading opportunity.
Let’s explore the most common Outside Bar trading strategies through real chart examples.
3.1. Reversal Strategy
At the end of a well-established trend, the appearance of an Outside Bar pattern can signal a potential reversal. The stronger the preceding trend, the greater the likelihood of a reversal.
After a long-bodied candle appears, market momentum weakens, indicating a potential trend slowdown. In the example below, the trend ends following a large bearish candle and the formation of an Outside Bar pattern.
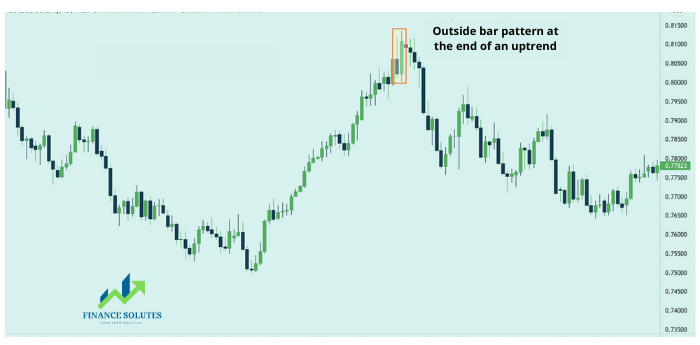
After three consecutive bullish candles following a long bearish candle, another bearish candle appears. At the end of trends, the Outside Bar pattern is often considered a reversal candlestick pattern.
Not only in downtrends, as illustrated above, but the Outside Bar can also act as a reversal pattern in uptrends. Take a look at the following example:
After multiple consecutive bullish candles, the uptrend slows down, and an Outside Bar pattern appears, signaling the end of the current trend and a potential price reversal.
Once the Outside Bar pattern is completed, a downtrend begins. Traders can enter a position after the pattern is fully formed.
- If the Outside Bar pattern appears after a downtrend, enter a buy order after the pattern completes. Set a stop-loss order below the lowest point of the Outside Bar pattern. The take-profit level depends on the trader’s strategy, but the risk-reward ratio should always be at least 1:2.
- Conversely, if it appears at the end of an uptrend, enter a sell order after the final candle of the Outside Bar pattern forms. The stop-loss order should be placed above the highest point of the newly formed candlestick pattern. Take-profit follows the same logic as in a downtrend scenario.
3.2. Trend Continuation
When the Outside Bar pattern appears during a pullback phase, it acts as a signal for trend continuation.
In the example below, the market is in a long-term uptrend. Small accumulation phases are normal in an extended trend, as they represent periods of struggle between buyers and sellers for market control.
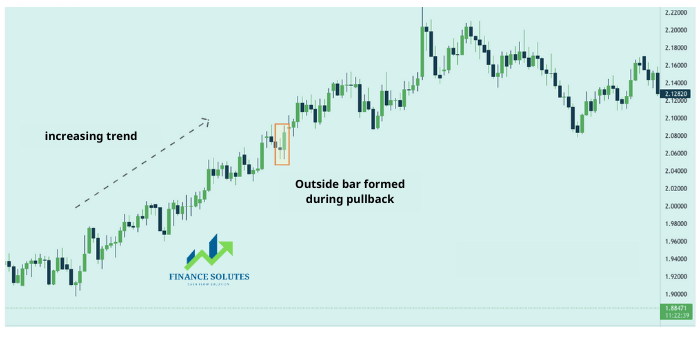
The trend continues when the opposing side lacks the strength to reverse the market. When the Japanese candlestick Outside Bar pattern appears in this context, it signals that the trend still has momentum to continue.
Of course, trends do not last forever; traders should only enter forex trades when this Japanese candlestick pattern appears during the first few pullback phases.
This approach helps traders avoid the risk of entering trades too late in the trend. The most effective forex trading strategy remains trend-following methods.
In an uptrend, traders will use this strategy to look for buying opportunities. The stop-loss order should be placed below the lowest point of the Japanese candlestick pattern. The opposite applies to a downtrend.
3.3. Breakout Trading
The breakout trading strategy discussed here involves price breaking out of an accumulation range. Let’s take a look at the following example: After an uptrend, the price enters a range-bound phase, also known as a sideways or accumulation period.
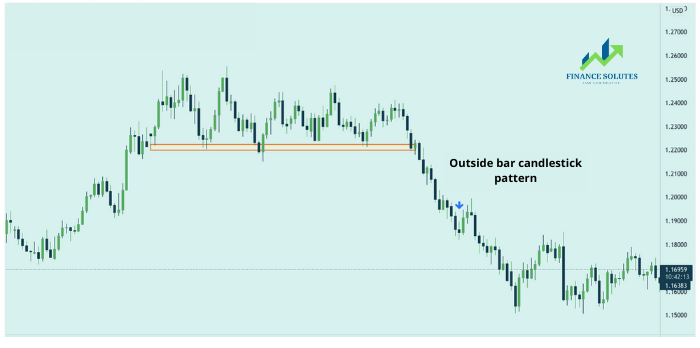
The price continues to trade above the support zone marked in yellow. In this case, after multiple attempts to hold the support level, buyers fail to defend it.
The selling pressure drives the price higher, breaking through the support level. Although, in most cases, we cannot be certain whether a breakout is genuine or a false breakout, one thing is clear: after a consolidation phase, the price will eventually break out of the range. The longer the accumulation period, the stronger the breakout momentum.
The price breaks out with an Outside Bar pattern. Then, as the trend progresses, another Outside Bar pattern appears during the first pullback, providing an additional trading opportunity. Traders can enter a position and set stop-loss levels similarly to the trend continuation setup.
4. LIMITATIONS OF TRADING WITH THE OUTSIDE BAR PATTERN
- The stop-loss placement distance from the entry point is relatively large, meaning traders must carefully calculate their lot size.
- The Outside Bar pattern appears frequently on charts, so not every occurrence provides a valid trading opportunity.
5. CONCLUSION
Despite these limitations, the Outside Bar pattern remains a simple yet effective trading strategy. This holds true even for beginner traders. Additionally, the pattern offers a favorable risk-reward ratio.
Once traders develop a strategy with effective risk management and consider the market context, candlestick patterns like the Outside Bar can provide relatively high-probability trading opportunities.
Therefore, Finance Solutes reminds you never to forget setting a stop-loss order when trading and to continuously enhance your fundamental trading knowledge.
- t.me/finance_solutes
- Website: https://finance-solutes.com
- Hotline: +1 929 5636 439 ( Hotline )
- 26 Broadway, Suite 934, New York, 10004, US
