
 XM
XM Bybit
Bybit Binance
 Robinhood
 Webull
 IC Markets
 Pepperstone
 OKX
OKX Vantage
 VT Markets
 BingX
BingX Gate.io
 Kucoin
 MEXC
MEXC Exness
 Bitget
Forex traders often tend to look for reversal signals from candlestick patterns. However, one skill that has yet to be fully utilized is the use of continuation candlestick patterns, which indicate that the market is pushing to continue the trend. Today’s article will help traders better understand continuation candlestick patterns and important considerations when using these trend-following formations.
1. CONTINUATION CANDLESTICK PATTERNS
Japanese rice traders discovered recurring patterns in candlestick formations, which helped them predict future price movements. These patterns have now become an established price action trading method used across all modern financial markets, especially in forex trading.
The most common approach forex traders take is searching for reversal candlestick patterns. However, focusing solely on reversals can cause traders to miss some of the best trading opportunities by overlooking continuation candlestick patterns.
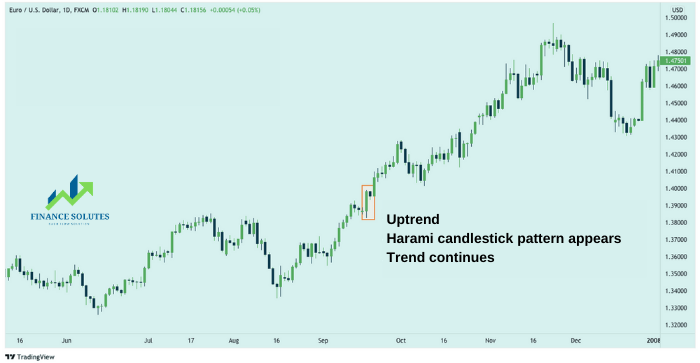
A continuation candlestick pattern is a Japanese candlestick formation consisting of 1 to 5 candles. It signals that the short-term trend seen in the previous few candles will continue in its current direction.
Continuation patterns are often characterized by sideways movement following a strong directional move. They represent a pause in a trend. However, this is not always the case, as some continuation patterns (such as gaps) indicate that the trend is accelerating.
2. SUMMARY OF COMMON CONTINUATION CANDLESTICK PATTERNS
2.1. Three Methods Candlestick Pattern
The Three Methods candlestick pattern is divided into two types: Falling Three Methods and Rising Three Methods.
2.1.1. Falling Three Methods
After a long bearish candlestick (red candle), there are 2-3 small bullish candles (green candles) in succession. It is crucial that these bullish candles do not close below the opening price of the large bearish candle. Their wicks should also not exceed the range of the first bearish candle. The final candle in this pattern opens within the body of the last small bullish candle and closes below the closing price of the initial large bearish candle.
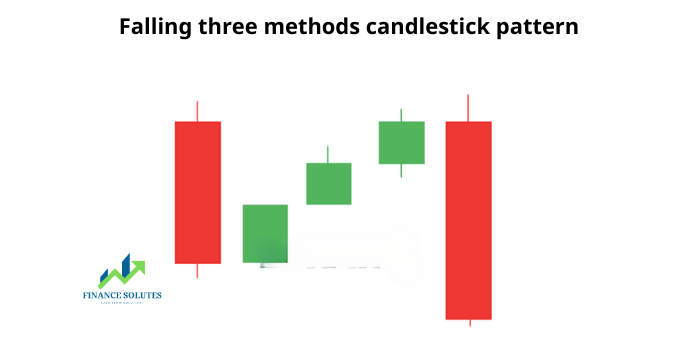
Initially, there is a preceding downtrend, where you will see a large bearish candlestick (red candle) within the downtrend. This candle indicates strong selling pressure.
After that, three small bullish candles (green candles) appear. These candles signal buying pressure but at an insignificant level. Finally, another large bearish candle forms, confirming the continuation of the trend. Once again, sellers regain control of the market. You can enter a trade on the last candle, meaning when the Falling Three Methods pattern is completed.
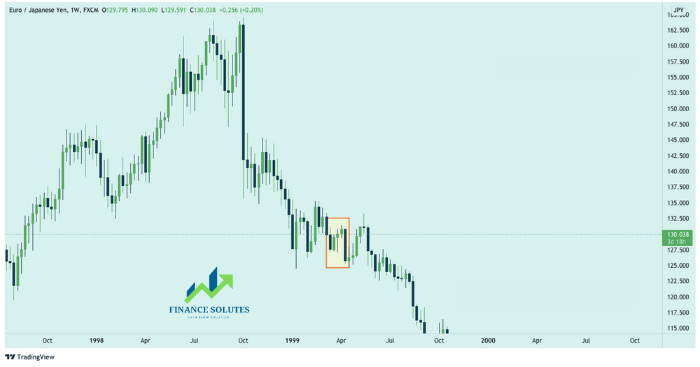
Real-life example of the Falling Three Methods pattern:
2.1.2. Rising Three Methods Candlestick Pattern
Opposite to the Falling Three Methods pattern, the Rising Three Methods pattern appears in an uptrend and consists of five candlesticks.
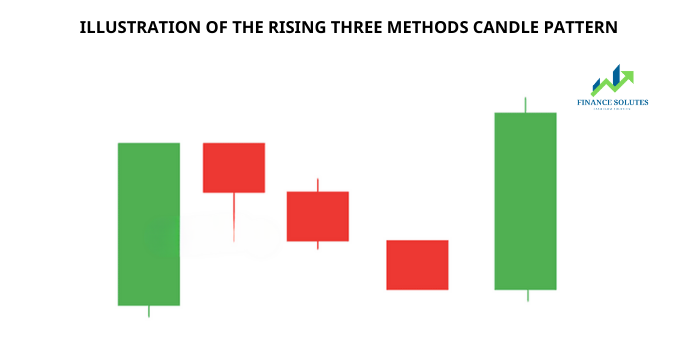
First, a long bullish candlestick forms, followed by three consecutive small bearish candles. Their wicks should not extend below the opening price of the initial bullish candle.
Finally, a long bullish candle closes above the first bullish candle. If you are familiar with chart patterns, you will notice that this formation closely resembles a bullish flag pattern.
The logic behind this trend continuation pattern is that the market experiences a slight pullback after a strong upward move, but then buyers step in, ready to push the price higher again.
2.2. Harami Candlestick Pattern
The Harami candlestick pattern is also divided into two types: Bearish Harami and Bullish Harami. It consists of two consecutive candlesticks.
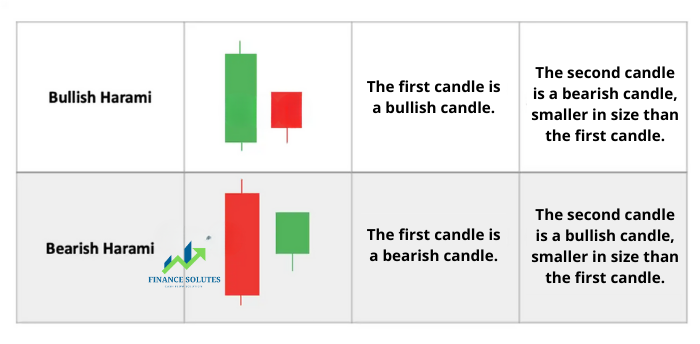
The name “Harami” comes from its external shape. In Japanese, “Harami” means “pregnant.” Looking at the illustration below, don’t you think this pattern resembles a pregnant woman?
Besides the standard pattern, traders also pay attention to its variations. Unlike the standard version, variations of the Bullish Harami pattern include cases where the second candle is a special type, such as a Pin Bar.
The Bearish Harami and Bullish Harami patterns are considered areas where price temporarily pauses before continuing the previous trend. They signal that the price may resume the trend with strong momentum.
2.3. Three Line Strike Candlestick Pattern
Similar to the continuation candlestick patterns mentioned above, the Three Line Strike pattern is also divided into two types: Bullish Three Line Strike and Bearish Three Line Strike. This continuation pattern consists of four individual candles.
In an uptrend, the first three candles must close higher than the previous one. The last candle is a bearish candle, forming a new higher low compared to the previous low. Conversely, in a downtrend, the first three candles close lower than the previous one. The last candle is a bullish candle, forming a new lower low.
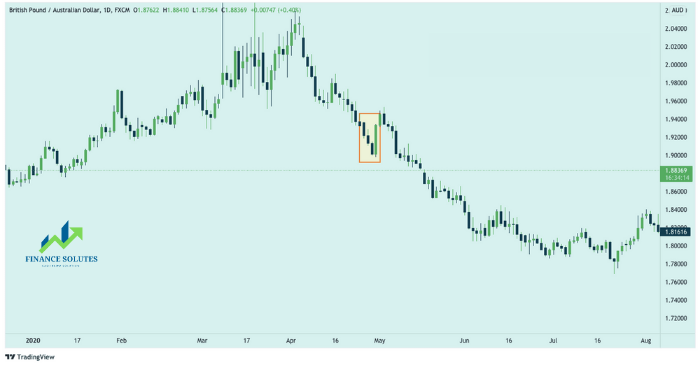
Below is an example of a Bearish Three Line Strike pattern:
3. IMPORTANT NOTES WHEN USING CONTINUATION CANDLESTICK PATTERNS
Like any other strategy or tool in forex trading, traders should keep the following points in mind when using these continuation patterns:
3.1. A Continuation Candlestick Pattern Alone Does Not Create a Profitable Strategy
If simply using a continuation candlestick pattern could guarantee stable profits, every trader would be a millionaire. However, the reality is that over 90% of traders in this market experience losses.
Candlestick patterns appear frequently in the market, which means they also generate many false signals. Traders should always wait for confirmation before entering any position.
3.2. Combine Continuation Patterns with Indicators and Other Tools
This rule follows directly from the first one. Since candlestick patterns can provide false signals, traders need to combine them with technical indicators and other analysis tools to confirm trade signals. This helps minimize cases of false breakouts or fake patterns.
3.3. The Validity of a Candlestick Pattern Depends on Its Location on the Chart
Last but not least, traders must always pay attention to where a candlestick pattern forms. A reversal candlestick pattern that appears before the trend has ended is invalid. Similarly, a continuation candlestick pattern forming during a sideways market is also invalid.
4. CONCLUSION
As repeatedly mentioned in our forex knowledge series, no trading tool provides 100% accurate signals. Therefore, always combine them with other tools to minimize risks in trading.
Thank you for reading! Wishing you a smooth and successful trading day!
- t.me/finance_solutes
- Website: https://finance-solutes.com
- Hotline: +1 929 5636 439 ( Hotline )
- 26 Broadway, Suite 934, New York, 10004, US
