
 XM
XM Bybit
Bybit Binance
 Robinhood
 Webull
 IC Markets
 Pepperstone
 OKX
OKX Vantage
 VT Markets
 BingX
BingX Gate.io
 Kucoin
 MEXC
MEXC Exness
 Bitget
The Dark Cloud Cover candlestick pattern is widely used by traders to detect market reversals and offers an attractive risk-to-reward ratio.
The Dark Cloud Cover pattern is relatively easy to spot. However, traders should consider the formation of the Dark Cloud Cover in conjunction with other important factors and avoid entering trades solely based on the appearance of the pattern.
Dark Cloud Cover is a type of forex candlestick, and before proceeding, you should ensure that you have a solid understanding of how to read candlestick charts.
1. WHAT IS THE DARK CLOUD COVER CANDLESTICK PATTERN?
The Dark Cloud Cover candlestick pattern is a reversal pattern that signals a potential downward trend. It appears at the top of an uptrend. The Dark Cloud Cover pattern consists of a large bullish (green) candle followed by a bearish (red) candle; the red candle makes a new high before closing below the midpoint of the previous green candle.
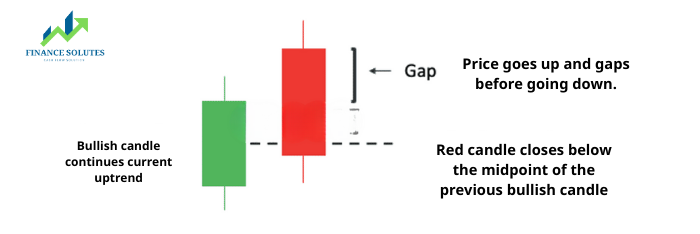
You should not confuse the formation of the Dark Cloud Cover pattern with the Bearish Engulfing pattern. Both signal a potential trend reversal, but the Dark Cloud Cover provides more attractive entry points due to the bearish candle’s close being higher than that observed in the Bearish Engulfing pattern.
2. HOW TO IDENTIFY THE DARK CLOUD COVER CANDLESTICK PATTERN ON A FOREX CHART
Steps to identify the Dark Cloud Cover pattern:
- Identify the current uptrend.
- Look for signs that momentum is weakening or reversing (using tools like stochastic oscillators, moving average crossovers, or the appearance of a bearish candlestick).
- The price will rise and form a “gap,” with the red candle opening above the previous green candle’s close — although this is rarely seen in forex candlesticks as they typically open at or very near the previous candle’s close.
- Ensure the red candle (the second candle) closes below the midpoint of the first candle.
- Look for confirmation of the new downward trend.
3. HOW TO TRADE USING THE DARK CLOUD COVER CANDLESTICK PATTERN
Traders can look to trade this pattern in traditionally trending markets such as the GBP/USD or EUR/USD price charts, or combine the Dark Cloud Cover candlestick pattern with technical analysis in range-bound markets.
3.1. Trending Markets
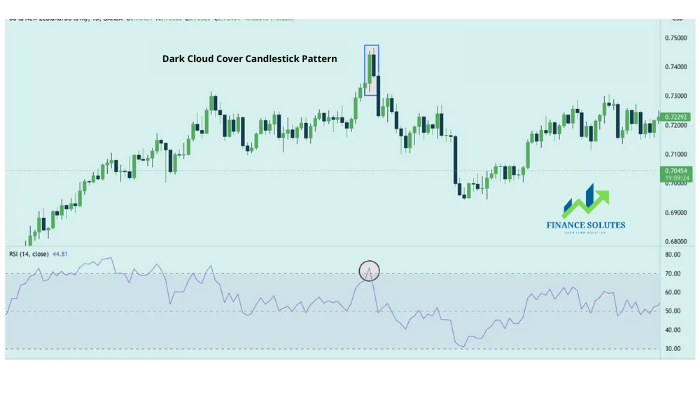
Below is an example of the Dark Cloud Cover pattern in forex, specifically the GBP/USD currency pair. Refer to the chart below for further details. The steps for identifying a Dark Cloud Cover can be used to analyze a potential trade: the presence of higher highs and higher lows indicates an uptrend.
On the chart, it can be observed that the market began to range when the most recent upward move started to flatten. As it moved higher, the movement was not as strong or clear as previously observed. Additionally, the RSI moved into the overbought zone, providing greater confidence in the trade.
The red candle opens with a slight “gap” above the green (bullish) candle before it. In the forex market, bearish candles usually open at the same level as the previous close. The second bearish candle continues downward and closes below the midpoint of the bullish candle, suggesting that sellers have overpowered buyers at that level.
3.2. Trading Application – Entry Point
Confirmation of continued selling (downward pressure) is seen in the following candle and the candles that follow. The appearance of lower highs and lower lows then provides evidence that the market has successfully reversed and a downtrend has been established.
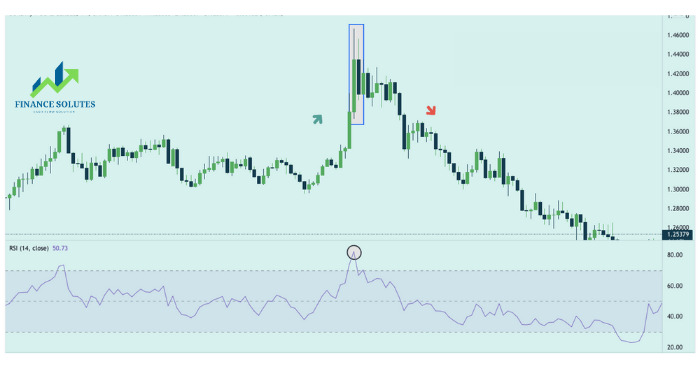
It is relatively easy to identify entry points, take-profit levels, and stop-loss levels when viewing the zoomed-in chart below. The entry point can be placed at the opening of the next candle, following the formation of the Dark Cloud Cover pattern.
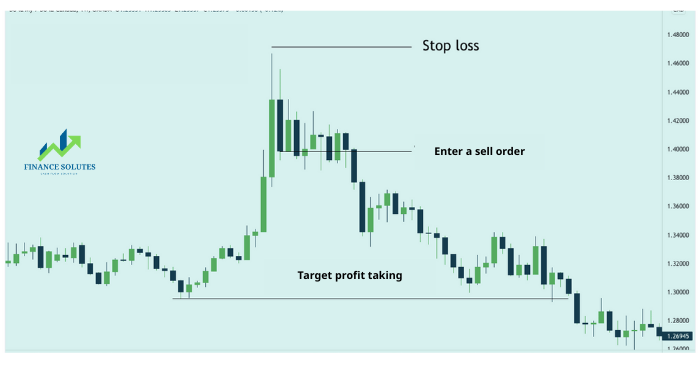
Stop-loss levels can be placed above the recent high. The initial take-profit level can be set at key areas or nearby support/resistance zones. It’s important to note that trading with the Dark Cloud Cover pattern may signal the beginning of a prolonged downward move. Therefore, traders may consider setting multiple take-profit targets.
3.3. Sideways/Range-Bound Markets
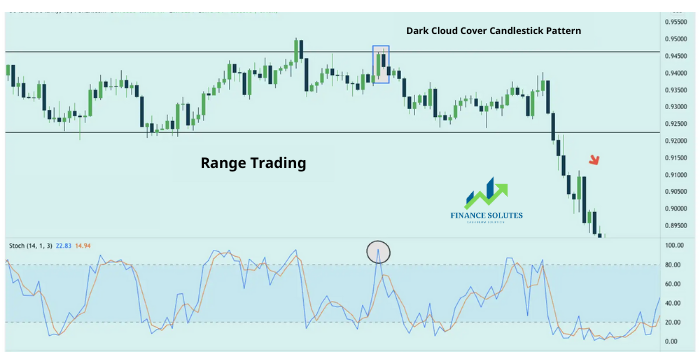
A similar strategy can be applied in a range-bound market, where prices tend to ‘bounce’ between support and resistance levels. The example below shows a consolidation phase on the GBP/USD daily (D1) chart. At that time, it was clearly a non-trending market. The Dark Cloud Cover pattern appeared near a resistance zone, providing a sell signal — and if momentum is strong enough, it can lead to a breakout trade, as it did in this example.
4. ADVANTAGES AND LIMITATIONS OF THE DARK CLOUD COVER PATTERN
The validity of the Dark Cloud Cover pattern, like all candlestick patterns, depends on the surrounding price action and indicators. Where the Dark Cloud Cover appears within the trend and near key resistance levels also plays a critical role. In forex trading, here are some of the key advantages and limitations of the Dark Cloud Cover pattern:
| Advantages |
Limitations |
|
|
- t.me/finance_solutes
- Website: https://finance-solutes.com
- Hotline: +1 929 5636 439 ( Hotline )
- 26 Broadway, Suite 934, New York, 10004, US
