
 XM
XM Bybit
Bybit Binance
 Robinhood
 Webull
 IC Markets
 Pepperstone
 OKX
OKX Vantage
 VT Markets
 BingX
BingX Gate.io
 Kucoin
 MEXC
MEXC Exness
 Bitget
For forex traders, especially those who follow the price action school of thought, Japanese candlestick patterns are surely no stranger. The Inside Bars pattern – one of the most common tools. And as mentioned in previous articles, traders should not view candlestick patterns as the sole tool but rather combine them with other tools and indicators.
Today’s article will introduce traders to a powerful combination; helping forex trading become more efficient. That is the combination of MACD and Inside Bar – a trend indicator.
1. INSIDE BAR AND MACD
An overview of the concepts and typical characteristics of inside bar and MACD:
1.1. MACD Trend Indicator
MACD stands for Moving Average Convergence and Divergence. This is a very well-known and widely used indicator among traders. It is a versatile indicator that reveals market trends and highlights momentum.
The MACD indicator is composed of the MACD line, the Signal line, and the Histogram. Additionally, the MACD line is considered a fast-moving average line, while the Signal line is a slow-moving average line.
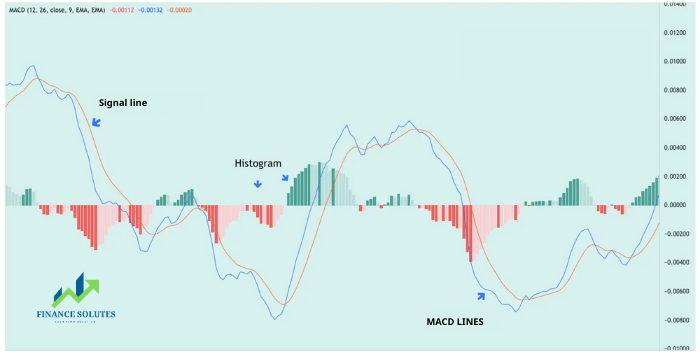
When the market is in an uptrend, both the MACD line and the Signal line are above the 0 line; the Histogram is green. The opposite is true for a market in a downtrend.
Traders often use the golden cross signal, meaning the crossover between the MACD line and the Signal line, as a method to enter trades.
1.2. Japanese Candlestick Pattern – Inside Bar
Regarding the concept of the Inside Bar pattern, previous articles have already covered it in detail. Traders only need to remember that the Inside Bar pattern features a candle that is completely within the range of the previous candle, also known as the mother candle. Ideally, the inside bar should be located in either the upper half or lower half of the mother candle.
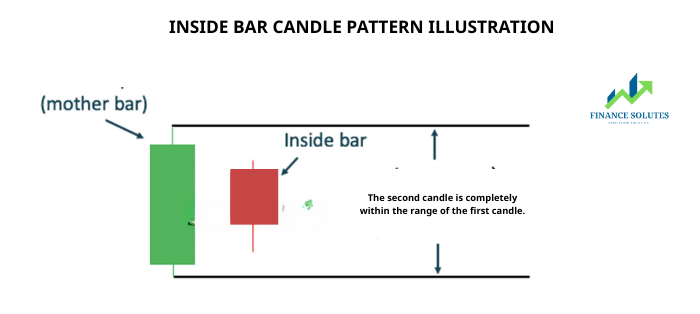
Additionally, the Inside Bar can also be a Pin Bar. Therefore, many traders, when seeing a Pin Bar within this pattern, often refer to it as a “Pin Bar Inside Bar.” The Pin Bar Inside Bar pattern is also a common candlestick formation in the market.
The Inside Bar pattern can appear on any time frame. However, traders mainly focus on Inside Bar setups on the daily chart when considering trade entries. This is because lower time frames tend to have more noise, and the Inside Bar may give off inaccurate signals.
Inside Bars can appear within a trend, and the Inside Bar reversal pattern can also occur at the top or bottom of a trend as a reversal signal.
2. STRATEGY: COMBINING INSIDE BAR AND MACD
Basically, this trading strategy is carried out by using MACD as a trend indicator and the Inside Bar pattern as a low-risk trade trigger with high probability of success.
This strategy tends to be more effective in trending markets. In ranging or sideways markets, Inside Bars may form due to price moving within a narrow range, while the MACD also moves sideways around the Zero line. In such cases, it is best to stay on the sidelines and observe the market rather than opening new positions.
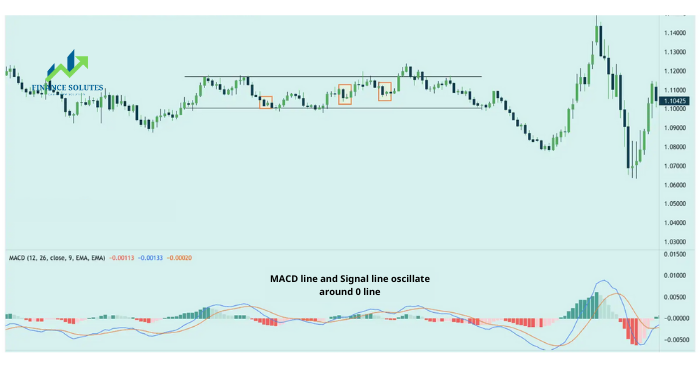
Looking at the EURUSD chart example provided above by Finance Solutes, it’s easy to understand why this strategy should not be applied when the market is ranging. That’s because even a slightly tight stop loss can immediately be hit—without giving the trade any chance to gain profit.
The trading idea when using the MACD and Inside Bar combination setup is:
– Buy trade: MACD is above the 0 line. Enter a buy order just one tick above the Inside Bar pattern.
– Sell trade: The opposite applies for a sell trade. MACD is below the 0 line. Enter a sell order just one tick below the Inside Bar pattern.
3. REAL EXAMPLES OF COMBINING MACD WITH INSIDE BAR
3.1. Trending Market
To better understand this trading strategy, let’s analyze a few real-world examples.
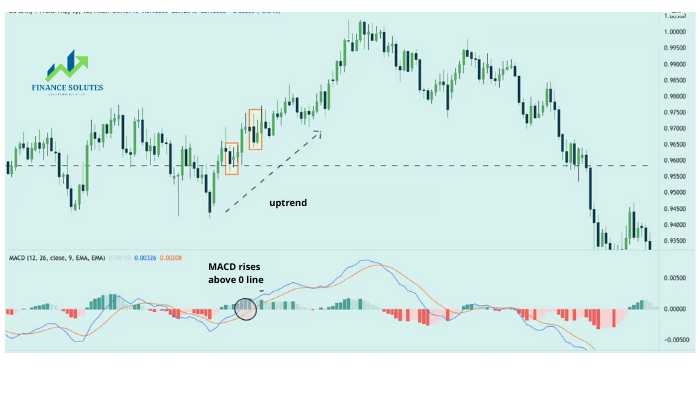
control and closed the candle below the opening price.
When the mother candle of the Inside Bar pattern forms, take a look at the MACD indicator. Both the MACD line and the Signal line cross above the 0 line. The strong upward momentum led the MACD to cross above the 0 line. Price had fallen to a support zone, after which the Inside Bar formed.
According to theory, when the MACD is above the Zero line, and once the Inside Bar pattern is completed, a buy order can be placed about one tick above the Inside Bar pattern. The stop loss can be placed just below the mother bar.
3.2. Ranging Market
After reviewing another example in a trending market, let’s now analyze a different scenario—a choppy or unclear market. A choppy market can be considered as a non-trending state, or a market with a trend that is difficult to trade. “Sideways” is an easier way to describe this condition. 80% of the time, the market is in a choppy state. In reality, you’ll also notice that clear trends appear only occasionally, while most of the time, price moves in a boring and uneventful manner. However, this boring movement often contains significant risk.
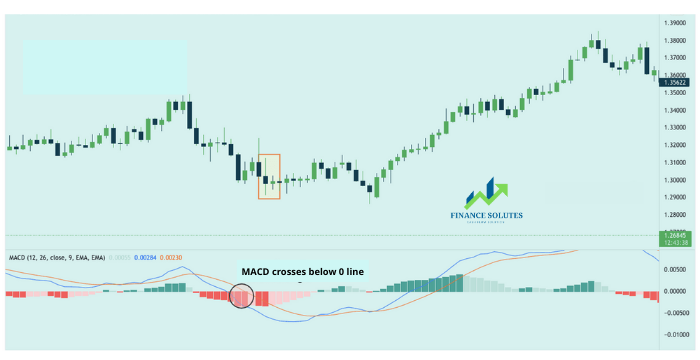
The chart above shows the GBPCHF pair on the daily time frame. The MACD crosses below the 0 line, signaling a downtrend. However, before the Inside Bar pattern forms, there was a bearish candle with a long upper wick that failed to break the previous low. This was followed by another bearish candle with a smaller body and a long wick.
These conflicting signals are likely to create uncertainty among traders. When traders are uncertain, breakouts tend to fail.
According to theory, when MACD is below the 0 line and an Inside Bar forms, a sell order would be placed. However, if a sell order were entered here and a stop loss placed above the Inside Bar or the mother bar, the trade would have failed within just a few days. From this, we can see the ineffectiveness of this strategy in a ranging market.
4. SUMMARY
This is a simple and easy-to-apply strategy that combines MACD and Inside Bar—both of which are powerful tools popular among forex traders. However, remember to only use this strategy in a clearly trending market. In a ranging market, this trading method does not yield effective results.
As always mentioned in every article, no matter how effective or powerful a strategy is, never forget to place a stop loss to protect your account. Wishing you a successful trading day!
- t.me/finance_solutes
- Website: https://finance-solutes.com
- Hotline: +1 929 5636 439 ( Hotline )
- 26 Broadway, Suite 934, New York, 10004, US
