
 XM
XM Bybit
Bybit Binance
 Robinhood
 Webull
 IC Markets
 Pepperstone
 OKX
OKX Vantage
 VT Markets
 BingX
BingX Gate.io
 Kucoin
 MEXC
MEXC Exness
 Bitget
The Hanging Man Pattern is a Reversal Candlestick Pattern. It appears quite frequently on Forex charts. However, many traders still confuse this pattern with the Hammer candlestick pattern and are unsure how to use it most effectively.
Understanding when a trend reversal might occur and how to manage your risk accordingly is essential. This article will help clear up all those questions—from how to differentiate this pattern to how to trade it.
1. WHAT IS A HANGING MAN CANDLESTICK?
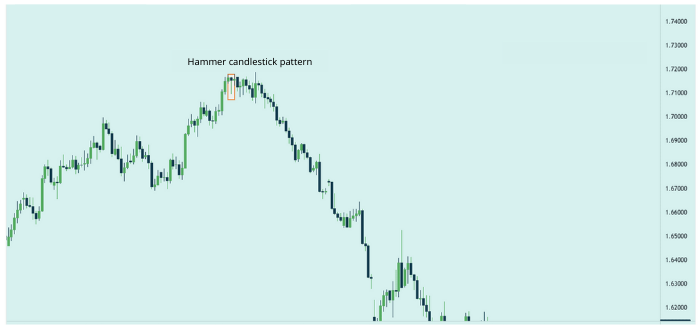
The Hanging Man pattern is one of the commonly seen reversal candlestick patterns in Forex trading. The Hanging Man candlestick is formed by a single candle and typically appears at the top of an uptrend.
This pattern is popular because it is considered a reliable tool for predicting potential trend changes. It is often mistaken for the Hammer pattern because both have a small real body with the closing price close to the opening price. The lower shadow of the Hanging Man is at least twice the length of the body.
A reversal may not begin immediately after the Hanging Man candlestick forms. Instead, it signals that the current momentum might be nearing its end as price action prepares for a potential trend shift.
The Hanging Man candlestick appears on the GBP/USD chart:
2. CHARACTERISTICS OF THE HANGING MAN CANDLESTICK PATTERN
To avoid confusing the Hanging Man with the Hammer pattern, traders should pay attention to the following when analyzing the Hanging Man:
– Uptrend: This candlestick pattern forms at the top of an uptrend.
– Open and Close Prices: The Hanging Man can be either a bullish (green) or bearish (red) candle. A bearish candle provides a stronger signal of market weakness. The closing and opening prices do not differ much, resulting in a relatively small real body.
– Upper Shadow: A short upper shadow indicates there was some effort to maintain the upward trend before prices fell.
– Long Lower Shadow: This is perhaps the most important visual aspect of the candle. It represents significant selling pressure before buyers attempted to regain control—forcing the closing price to hover near the opening level, although the price still declined during this session.
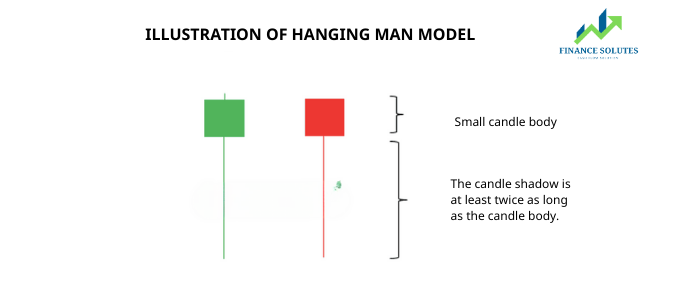
If the pattern appears on a chart with an uptrend, it signals a potential bearish reversal; this is the Hanging Man candlestick pattern. Conversely, if the candlestick appears during a downtrend, signaling a potential bullish reversal, it is the Hammer pattern.
3. TRADING THE HANGING MAN CANDLESTICK PATTERN
It’s important to consider the formation of the Hanging Man pattern in relation to the long-term trend. The best way to do this is by utilizing multi-timeframe analysis. Start by analyzing the market using longer timeframes such as daily or weekly charts to observe the market’s direction in the long-term trend. Then, move to shorter timeframes (such as 4-hour or 2-hour charts) to identify the ideal entry points based on your forex trading skills and knowledge.
3.1. Identify the Long-Term Trend
Look at the chart on a longer timeframe (e.g., daily chart) to determine the direction of the market. You should avoid trading against the long-term trend.
3.2. Find Your Ideal Entry Point Based on the Pattern’s Location
Using a shorter timeframe chart (e.g., 4-hour chart), identify your ideal entry point. The formation of the Hanging Man pattern signals an opportunity for a sell trade.
3.3. Use Additional Supporting Indicators
Does the RSI indicator confirm that the market has reversed and is now in a downtrend? Has the 20 EMA crossed below the 50 EMA? Is the Hanging Man candlestick forming near the peak of a short-term uptrend?
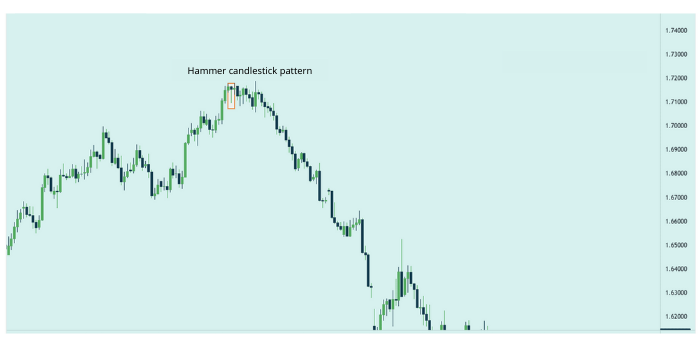
In the EUR/JPY 4-hour chart above, the dominant trend of the market is an uptrend. The Hanging Man candlestick appears at the peak of the trend. Combined with the RSI indicator, which is above 70, this signals an overbought market.
3.4. Enter Your Trade
Look for an entry point at the lowest part of the Hanging Man candlestick pattern. If your bearish market prediction is correct, you may see the price action move downwards, providing a signal for you to execute a sell trade.
3.5. Risk Management
Make sure to place your trade according to your position size strategy. Consider the total account value you’re willing to risk at any given time, and stick to this. Refer to the article “Risk of Using the 2% Risk Management Rule in Forex” by TradaFX. And always set your stop loss at the highest point of the Hanging Man candlestick pattern.
3.6. When to Close Your Trade?
Whenever you enter a trade, it’s best to always have a risk:reward ratio of at least 1:2. This means you’re risking half of what you aim to gain. It also means the distance from your entry point to your take-profit level should be twice the distance from your entry point to your stop loss. By applying this simple technique, even if you only get half of your trades correct, your trading account will remain profitable.
4. CONCLUSION
Traders can maximize the potential of the Hanging Man pattern. When you have evidence that a trend is nearing its end, you should consider levels where you can close your trade. Conversely, when an uptrend is about to end and there’s evidence of a potential reversal, it presents a great opportunity to profit. Combine this with other tools to increase your success rate, and always remember to set your stop loss when trading.
- t.me/finance_solutes
- Website: https://finance-solutes.com
- Hotline: +1 929 5636 439 ( Hotline )
- 26 Broadway, Suite 934, New York, 10004, US
