
 XM
XM Bybit
Bybit Binance
 Robinhood
 Webull
 IC Markets
 Pepperstone
 OKX
OKX Vantage
 VT Markets
 BingX
BingX Gate.io
 Kucoin
 MEXC
MEXC Exness
 Bitget
The Engulfing Candlestick Pattern in the Forex Market offers a useful way for traders to enter the market with a forecast of a potential trend reversal.
1. HOW TO IDENTIFY THE ENGULFING CANDLESTICK PATTERN
The Engulfing candlestick pattern tends to signal a reversal of the current market trend.
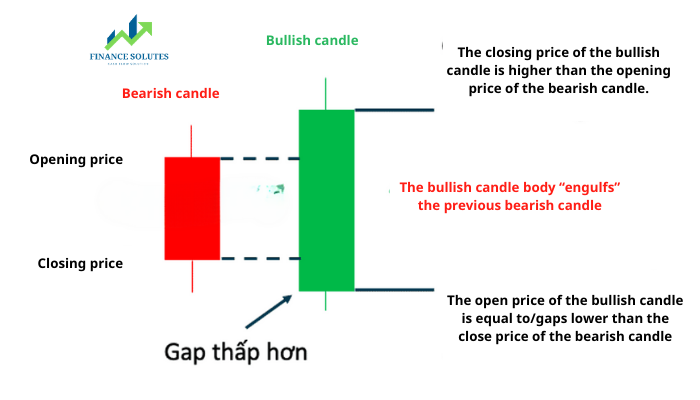
This pattern consists of two candlesticks, with the second one “engulfing” the entire body of the first. Whether the pattern is bullish or bearish depends on where it forms.
Below is an illustration of a bullish Engulfing pattern:
2. BULLISH ENGULFING CANDLESTICK PATTERN
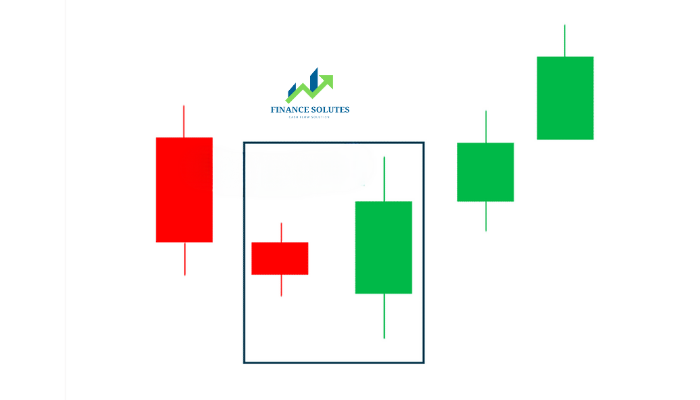
The Bullish Engulfing candlestick appears at the bottom of a downtrend and indicates increasing buying pressure. This pattern often triggers a trend reversal as more buyers enter the market to push the price higher. The pattern features a second candle that completely engulfs the body of the preceding bearish candle.
Engulfing Candlestick Pattern: Trading System With Engulfing Candlesticks
2.1. Signs to Identify a Bullish Engulfing Pattern
– A large green candle “engulfs” the body of the preceding red candle (ignoring the wicks)
– Occurs at the bottom of a downtrend
– Stronger signals are given when the red candle is a doji or when the following candles close above the high of the bullish candle.
2.2. Meaning
– Signals a bullish trend reversal (uptrend reversal)
– Selling pressure is weakening at this key support level.
2.3. Advantages of Trading the Bullish Engulfing Pattern
– Easy to identify
– Attractive entry points can be spotted after confirmation of the bullish reversal.
2.4. Applying the Bullish Engulfing Pattern in Trading
2.4.1. In Forex
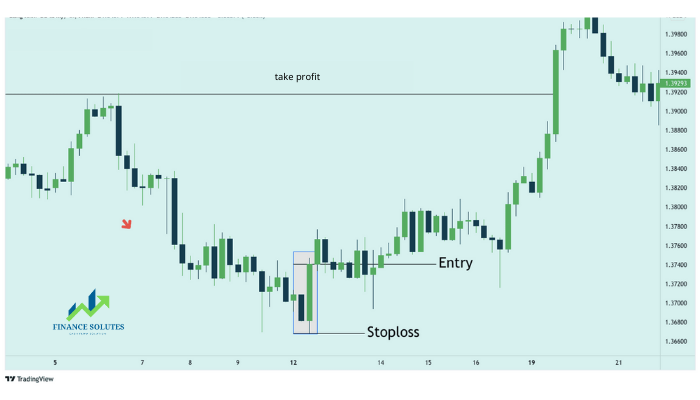
Take a look at the 4-hour chart example of the GBP/USD pair below. Here, the pattern occurs within a downtrend. The subsequent candles confirm the signal as they close above the high of the bullish candle.
Stop-loss points can be placed below the low of the Bullish Engulfing pattern; take-profit points are set where the price had previously reached – this is a nearby high and offers a positive risk:reward ratio.
2.4.2. In Stocks
The Bullish Engulfing candlestick pattern is not only a popular strategy in forex but can also be applied to the stock market. The example below shows the chart of FedEx Corp (FDX), listed on the NYSE.
To build confidence when trading a Bullish Engulfing pattern, it’s important to add confirmation through a supporting signal/indicator.
The chart below shows the presence of a Dragonfly Doji right before the Engulfing pattern – signaling a rejection of lower prices. This aligns with the uptrend along with an oversold signal from the Stochastic indicator at the bottom of the chart. These supporting signals provide traders with stronger confidence before executing the trade.
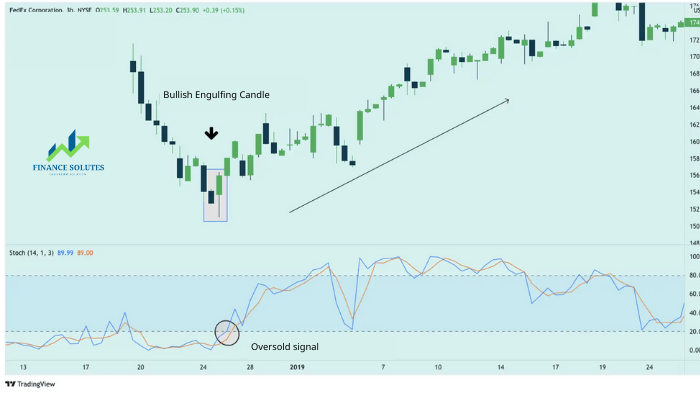
The stop-loss can be placed below the recent swing low – which is the low of the Dragonfly Doji. The take-profit level can be set at a key resistance area where the price had previously approached, as long as it results in a positive risk-to-reward ratio.
3. BEARISH ENGULFING CANDLESTICK PATTERN
The Bearish Engulfing pattern is simply the opposite of the bullish pattern. It provides the strongest signal when it appears at the top of an uptrend and indicates increasing selling pressure. This pattern consists of two candles, with the second one completely engulfing the body of the previous green candle.
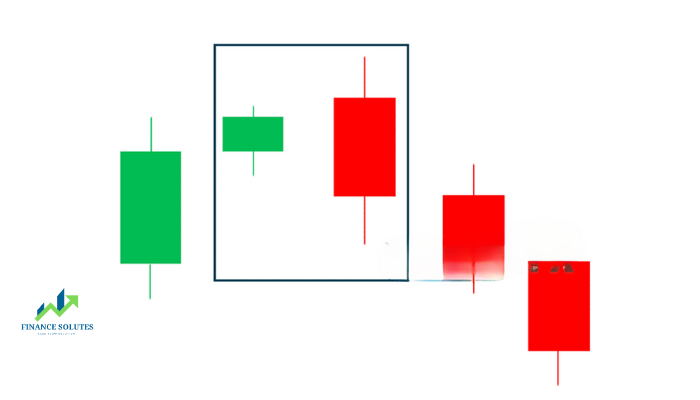
The illustration below shows a bullish and a bearish candle forming a bearish Engulfing pattern:
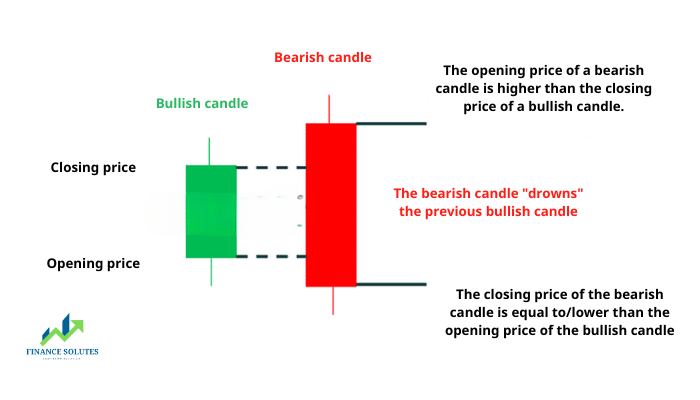
3.1. Signs to identify a Bearish Engulfing Pattern
– Identification: A red candle engulfs the previous (smaller) green candle
– Location: Appears at the top of an uptrend
– Signal: Bearish signal (trend reversal to the downside)
3.2. How to use the Bearish Engulfing Pattern
3.2.1. Using Indicators
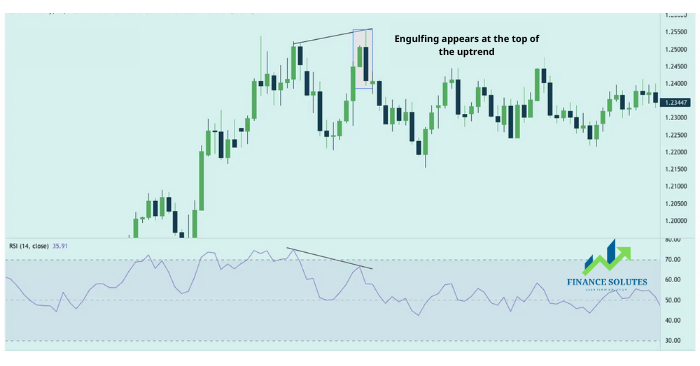
Below is a Bearish Engulfing pattern on the daily chart of the EUR/USD pair. It appears at the top of an uptrend. While trading against the trend is generally discouraged, in reality, reversals still occur; that’s why all traders should be able to spot this pattern when it forms.
The chart below shows the Euro strengthening and forming a peak. At that point, the Bearish Engulfing pattern appears. Additionally, the RSI indicator (circled) confirms the downtrend with an “overbought” signal.
Take a closer look at the chart below to clarify where the entry, stop loss and take profit points are determined:
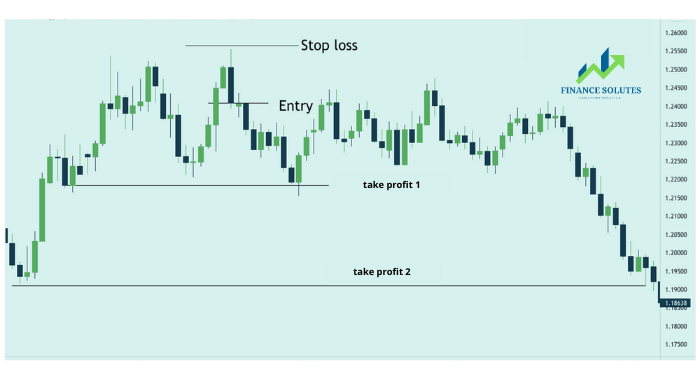
Entry: Traders can wait for the price to close below the low of the bearish candle or simply place trades well below the low of the bearish candle in the pattern.
Stop-loss: The stop-loss can be placed above a nearby high, as it would invalidate the trend movement and provide a reasonable risk-to-reward ratio.
Target/Take-profit: Since the Bearish Engulfing pattern may indicate the beginning of a prolonged downtrend, it can be useful to set an initial take-profit level while keeping the position open to ride the downward move. Adjust the stop-loss accordingly or consider using a trailing stop.
3.2.2. Using Support & Resistance Levels
The chart below shows a Bearish Engulfing pattern forming at a resistance level on the U.S. Dollar Index (DXY) chart. The resistance level here indicates that upward movements had previously been rejected. This adds further confidence to the bearish trend signal.
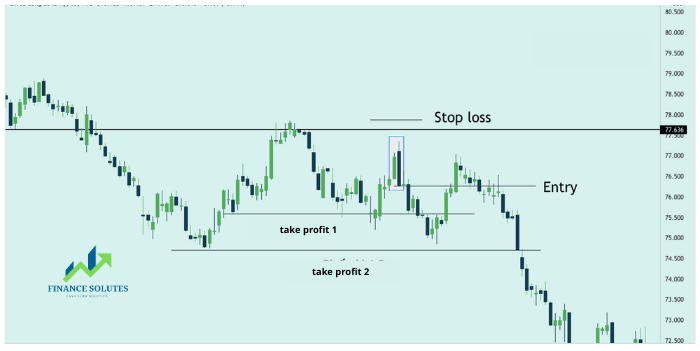
Entry: Considering whether the Bearish Engulfing pattern is supported by a resistance level, traders may consider entering the trade when the next candle opens.
Stop-loss: The stop-loss can be placed above the Bearish Engulfing candle or the resistance level. Placing the stop-loss here helps prevent further upward movement of the price.
Target/Take-profit: The take-profit level can be placed at a nearby support level. Similar to the previous example, traders may consider a second take-profit level — or implement a trailing stop — since the Bearish Engulfing candle may signal the start of a sustained downtrend.
3.3. Advantages of Trading the Bearish Engulfing Pattern
When this pattern forms in the right context, you can observe a strong shift between bulls and bears — signaling that the bulls are weakening. The first candle is bullish, followed by a strongly bearish second candle, reflecting fierce competition that ends in a clear victory for the bears. When such resistance levels are present, traders should pay close attention because prices can drop by as much as 100 pips!
– It is a very simple pattern to identify. If you find it difficult, use a candlestick reversal indicator on MT4.
– The trading rules are simple and easy to follow.
– Trading on higher timeframes such as the daily or 4-hour chart can result in profits of 100+ pips per trade when trades go in your favor.
4. WHY IS THE ENGULFING CANDLESTICK PATTERN IMPORTANT FOR TRADERS?
The Engulfing pattern helps traders identify potential trend reversals. In addition, it can also indicate a strengthened trend, offering useful exit signals for traders:
– Reversal: Identifying a reversal is self-explanatory — it allows traders to enter trades at optimal levels and ride the trend to completion.
– Trend Continuation: Traders can look at the Engulfing pattern to confirm the continuation of the current trend; for example, spotting a bullish Engulfing pattern during an uptrend adds confidence that the trend will persist.
– Exit Strategy: The pattern can also serve as a signal to exit an existing trade if the trader is holding a position in a trend that is about to reverse.
The limitation of the Engulfing pattern lies in its tendency to sometimes indicate a pullback rather than a clear directional change. However, traders can look for further price action to minimize the risk of unfavorable outcomes.
With that, we’ve covered 6 important candlestick patterns in Forex. We hope that the knowledge summarized by Finance Solutes will help you trade more effectively.
Wishing you success!
- t.me/finance_solutes
- Website: https://finance-solutes.com
- Hotline: +1 929 5636 439 ( Hotline )
- 26 Broadway, Suite 934, New York, 10004, US
