
 XM
XM Bybit
Bybit Binance
 Robinhood
 Webull
 IC Markets
 Pepperstone
 OKX
OKX Vantage
 VT Markets
 BingX
BingX Gate.io
 Kucoin
 MEXC
MEXC Exness
 Bitget
JJRVAT’s Price Action Trading Approach – A price action trading approach is not something specific like a setup or a forex trading strategy. But it’s even more useful because it provides market perspectives that can support you in forming your own trading strategy. In this article, you’ll learn about a scalp-style trading approach conveyed by Jjrvat.
Remember that we’re discussing an approach, not a rigid setup. You can design your own setup parameters after evaluating the ideas within this strategy.
Now, let’s dive into the core of JJRVAT’s Price Action approach:
– The basic idea here is to have a slow-moving average to determine the general direction of the market.
– Then, use a fast-moving average to help identify price swings.
– Once you clearly see higher highs and higher lows (or lower highs and lower lows), you may determine whether the market structure is in an uptrend or downtrend.
– From that point, try to enter the market on a pullback.
1. JJRVAT’S PRICE ACTION TRADING RULES
The rules below are not set in stone. Adjust them to suit your style. Here, parameters are secondary — consistency is the key.
1.1. Trading Tools
– 240-period Weighted Moving Average (WMA) to highlight the overall market direction.
– 21-period Hull Moving Average (HMA) to clarify price movements through its slope.
– The Hull Moving Average (HMA) is a very smooth and effective tool for tracking price swings.
1.2. Buy Trade Rules
– The 240-period WMA is sloping upwards.
– The 21-period HMA shows higher highs and higher lows.
– Wait for the HMA to begin pulling back downward.
– Buy when price closes above the HMA.
However, if the pullback dips below the most recent swing low (creating a lower low), the setup becomes invalid.
1.3. Sell Trade Rules
– The 240-period WMA is sloping downwards.
– The 21-period HMA shows lower highs and lower lows.
– Wait for the HMA to begin pulling back upward.
– Sell when price closes below the HMA.
However, if the pullback rises above the most recent swing high (creating a higher high), the setup becomes invalid.
These rules provide a focal point for your analysis. But feel free to discard them if you have valid reasons to do so. In short, make decisions like a trader.
Valid reasons usually stem from your own price action observations. You’ll see examples of this below.
2. TRADE EXAMPLES
Before we dive into the chart examples, note a few key points.
In the following examples, we apply the daily (and even monthly) timeframes. But isn’t this supposed to be a scalping strategy? So how does that work?
Here, the scalping concept refers to catching a single price swing. You can apply it regardless of the trading timeframe. This premise will also guide us when it comes to taking profits.
Example #1: FDAX 3-Minute Chart
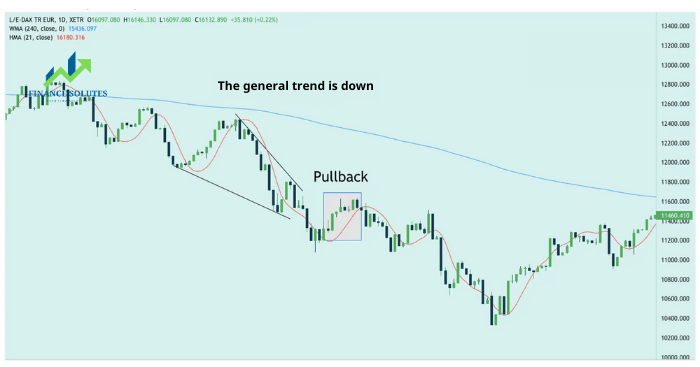
- This is an intraday trade example on the German FDAX contract.The WMA is sloping downward, indicating a bearish trend.
- The changing slope of the HMA highlights a series of progressively lower highs and lows, confirming a downtrend.
- The HMA signals the next pullback occurring here.
- This candle closes below the HMA and triggers a sell trade.
- Let’s focus on this bearish pin bar. If you look above the HMA and focus on the price action, you’ll notice that this candle forms a slightly higher high. It breaks the market structure we want to see. However, the bearish pin bar also signals rejection of upward momentum.
Therefore, overall, the sell setup is still acceptable.
Once you become familiar with this approach, you’ll realize that technical rules are only guidelines in this article by TradaFX.
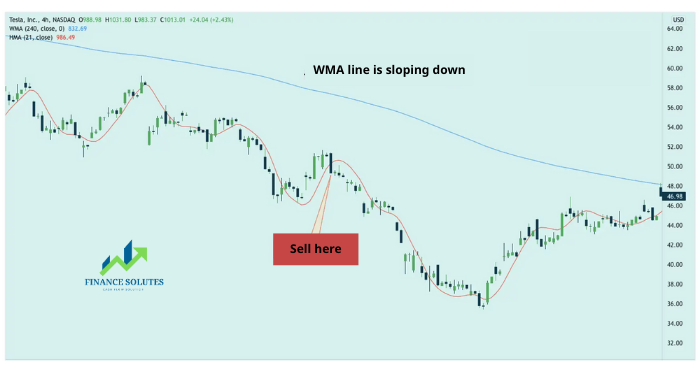
Example #2: Swing-Style Stock Trade (Winning Trade)
The candlestick chart below shows the price of Tesla stock listed on Nasdaq.
For easier analysis, the WMA and HMA lines change color based on their slope.
- Here, the WMA is sloping downward, showing a general downtrend.
- By using the price swings highlighted by the HMA, we can clearly distinguish higher lows and highs. This swing structure supported a bearish trend.
- During the subsequent pullback, a sell setup presented itself as price closed below the HMA.
Holding the position until the end of the down move led to solid profits.
Further Price Action Analysis
A lower low formed a double-bottom pattern with a previous swing low near the horizontal blue line.
Although an initially strong bullish candle pushed off that double bottom, the bullish momentum stalled and a doji candle pattern developed.
Interpreting this short-term bullish push as a bull trap made this sell setup even more attractive.
Example #3: Losing Trade
This is a 4-hour chart of Amazon listed on the Nasdaq.
- The red WMA line highlights a negative slope, implying a downtrend.
- The bold blue lines emphasize the lower highs and lower lows as identified by the HMA.
- During the next pullback, price closes below the HMA, and we enter a sell trade.
After stalling for about a day, the market suddenly reverses into an uptrend.
Let’s see if we can identify why this setup failed.
We can see lower highs and lows — there were indeed lower highs if we relied solely on the HMA indicator.
However, remember that this is a price-based approach, and the HMA is meant to highlight, not define, market structure.
If you focus on price action by observing the indicator color, you’ll notice that the lower highs are hardly distinguishable. Most candles cluster around a nearly flat HMA. That’s a sign that the HMA’s slope was unreliable for identifying price swings at that time.
Therefore, it’s likely that the market was in a range, and the market structure supporting a sell trade was weak.
Example #4: Forex Trade
This 1-hour chart is from the EUR/USD forex market. This example is almost textbook. As an exercise, compare the price action here to the losing example above.
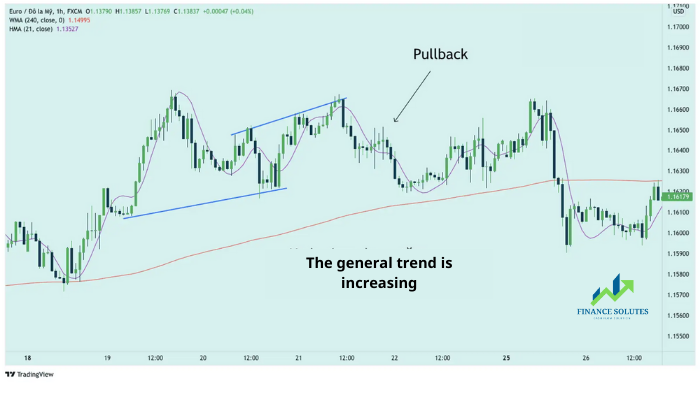
- The order of analysis is crucial. Always follow the trend. Here, the WMA is sloping upwards, indicating a bullish context.
- The HMA price swings highlight a solid bullish structure with a higher low followed by a higher high.
- This downward pullback is in order. This pattern often signals good opportunities for pullback trades.
- Two strong reversal candles push the market above the HMA and trigger a buy order.
Example #5: Long-Term Investment Timeframe
Price action methods are very flexible. We should be open to their applications. While this method was initially introduced for day trading, it’s also quite interesting when applied to long-term investments.
The chart below shows the monthly candlesticks of SPY, an ETF for the US market.
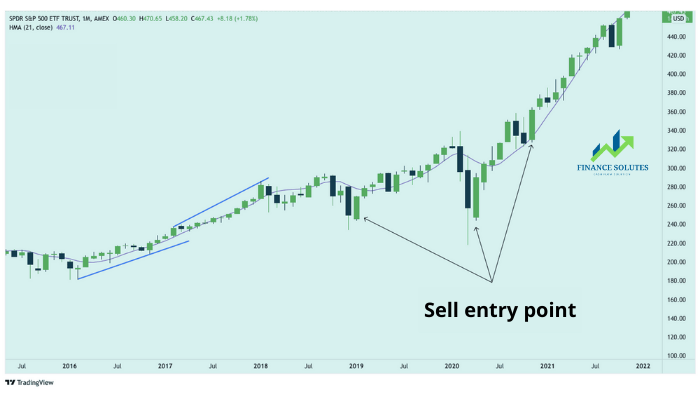
- Many investors hold a long position when they view the market with a long-term trendline. If that’s the case for you, you may choose to remove the WMA line as it adds little value to that premise.
- This means we are looking for a bullish market structure before considering a long-term position. Here is the group of higher lows and higher highs that first emerged after the 2008 crisis.
- These are potential buy signals that have occurred since then.
In this example, the price swings are quite gentle and clear. You can follow them easily.
However, since each candlestick represents a month, the biggest challenge here is patience.
3. SUMMARY
This is one of my favorite approaches. Although it uses two moving averages, it primarily focuses on price action.
The moving averages provide an initial market analysis. Use them to focus your analysis, but look beyond the lines and their colors.
A fundamental principle here is the order of analysis.
Order of analysis:
- General trend
- Price movements
- Trade trigger
In other words, context is crucial. Find the context before thinking about executing any trades.
Many new traders spend all their time searching for a “magic bullet” in trading without taking a step back to look at the bigger picture.
You don’t have to use WMA and HMA. Choose the trading tools that suit you, as long as you follow the same order of analysis.
There are two things to remember when using JJRVAT’s Price Action trading method:
- You are trading price action, not indicators. Don’t get caught up in indicators, as shown in the losing example above.
- This is an approach. It has many practical aspects.
When price action aligns with your HMA parameters, the price movements tracked by the HMA are almost perfect.
However, you’ll find that perfect tracking of price movements isn’t common. So, never rely entirely on the HMA. Learn to recognize when price action and the HMA are telling you different things. This is the key to successfully using this method.
- t.me/finance_solutes
- Website: https://finance-solutes.com
- Hotline: +1 929 5636 439 ( Hotline )
- 26 Broadway, Suite 934, New York, 10004, US
