
 XM
XM Bybit
Bybit Binance
 Robinhood
 Webull
 IC Markets
 Pepperstone
 OKX
OKX Vantage
 VT Markets
 BingX
BingX Gate.io
 Kucoin
 MEXC
MEXC Exness
 Bitget
Many traders choose to view charts as a simple way to identify trading opportunities. They often use technical indicators to do so. The Stochastic and MACD indicators are among the most popular methods used by traders to identify entry and exit signals under certain market conditions.
The purpose of this article, which is part of a forex knowledge series, is to evaluate how each indicator can be used to identify entry and exit signals under specific conditions; as well as to explore how they can be used together.
1. STOCHASTIC VS. MACD: WHICH INDICATOR IS BETTER?
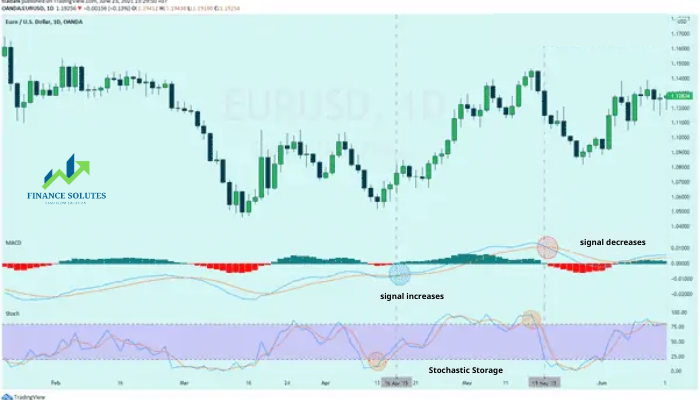
In the chart of the EUR/USD pair below; there is a strong uptrend underway; as seen on the price chart. When using the MACD stochastic indicator, the first crossover of the MACD line can be found when the MACD line (blue line) crosses above the signal line (red line); providing traders with a bullish signal. This indicates that both the price and momentum of the trend are increasing.
At the second crossover of the MACD line, the MACD line crosses below the signal line; giving a bearish signal. Because the crossover still occurs above the zero line; this suggests that the momentum of the uptrend is slowing down; although the larger trend remains biased toward buyers. In both cases, the MACD crossovers correspond to what was happening on the price chart during that specific time period; while the Stochastic indicator provided false signals for the same measured scenario.
The example above was explained in a trending market; but what happens in a range-bound market?
Consider the example below, where the GBP/NZD pair is confined within a range (sideways trading). In this case, the MACD indicator provides less reliable signals compared to those given by the Stochastic indicator.
With the Stochastics indicator, a bullish signal can be found when the %K line (black line) crosses above the %D line (red dotted line). Similarly, a bearish signal occurs when the %K line crosses below the %D line. The strongest signals occur when there is a combination of an uptrend along with a move above the 20 level from below; or a combination of a bearish signal along with a move below the 80 level.
As indicated below, the first crossover of the Stochastic indicator occurs below the 20 level and meets the criteria for a bullish signal; suggesting that the GBP/NZD pair is oversold and prices may soon rise.
Similarly, the second and third crossovers occur from above the 80 level; where the %K line crosses below the %D line; indicating that the market is currently overbought and prices may decline. In this example, we see that the MACD crossovers are not entirely accurate; but the Stochastic indicator provides clearer entry and exit signals.
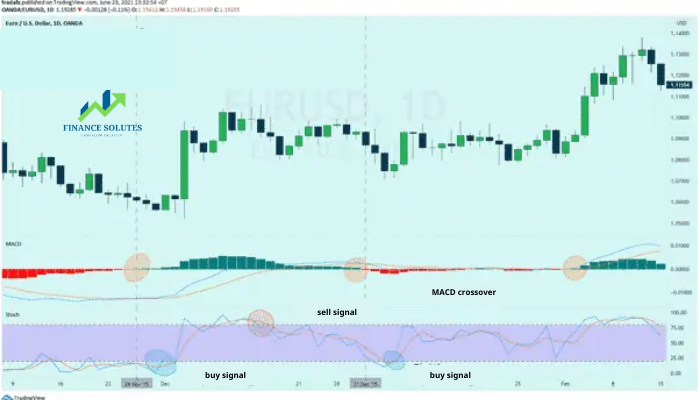
It can be seen that MACD is a more effective indicator in trending markets; while the Stochastic indicator tends to perform better in range-bound markets.
Next, we will explore how traders can combine the MACD and Stochastic indicators to obtain more optimal signals.
2. DOUBLE CROSS STRATEGY WITH STOCHASTIC AND MACD INDICATORS
When applying the Double Cross strategy with the Stochastic and MACD indicators, it is important to consider the criteria for both indicators when looking for potential signals.
In the chart of the US 500 index below, the crossover of the Stochastic indicator occurs when the %K line crosses above the %D line and below the 20 level. Shortly after, the MACD line crossover occurs when the MACD line (blue line) crosses above the signal line (red line) and is positioned below the zero line. This is a bullish signal in both cases; confirming that an uptrend is forming.
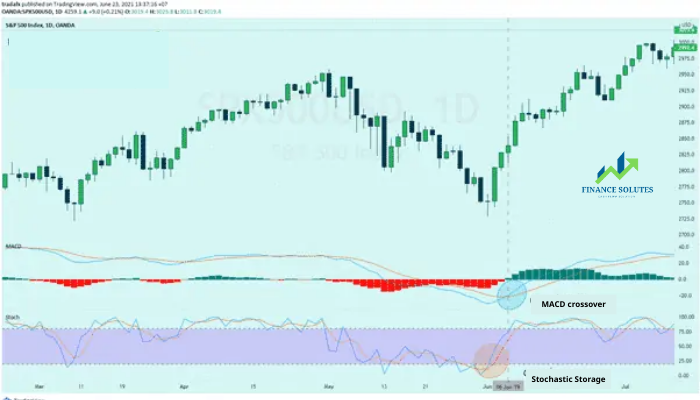
To use this strategy effectively, the crossover of the Stochastic indicator should occur just before the MACD line crossover. The reason is that the opposite case may generate a false trend signal.
The use of the MACD or Stochastic indicator will largely depend on factors within a trader’s approach. Based on the timeframe used, the level of comfort achieved, and previous successful cases (perhaps the biggest reason); some traders will prefer one indicator over the other, while some will use both.
3. FREQUENTLY ASKED QUESTIONS
3.1. Is there a way to reduce the likelihood of false signals?
One way to reduce the probability of false signals is through multi-timeframe analysis; using a higher timeframe to determine the overall trend and a lower timeframe to identify potential entry points.
The optimal ratio to use is 4:1. For example: A trader may use the 4-hour chart to determine the trend; and the 1-hour chart to identify potential entry points.
3.2. What settings should be used for the Stochastic and MACD indicators?
The default MACD settings are 12, 26 & 9. The default Stochastic settings are 5, 3 & 3. However, you can adjust these default settings.
For example: The MACD can be changed to 21, 55 & 9; while the Stochastic can be adjusted to 14, 3 & 3.
- t.me/finance_solutes
- Website: https://finance-solutes.com
- Hotline: +1 929 5636 439 ( Hotline )
- 26 Broadway, Suite 934, New York, 10004, US
