
 XM
XM Bybit
Bybit Binance
 Robinhood
 Webull
 IC Markets
 Pepperstone
 OKX
OKX Vantage
 VT Markets
 BingX
BingX Gate.io
 Kucoin
 MEXC
MEXC Exness
 Bitget
There is a big debate over which type of analysis is better for traders. So, between fundamental analysis and technical analysis in forex, which method is better? In this article, we will highlight the differences between the two types of analysis. Additionally, we will look at the news that traders tend to consider when trading forex.
1. COMPARING FUNDAMENTAL ANALYSIS AND TECHNICAL ANALYSIS
| Technical Analysis | Fundamental Analysis | |
| Definition | Predicting price movements using price charts | Economic data used to determine value/target price |
| Data Considered | Price movements (charts) | Inflation, GDP, interest rates, etc. |
| Time Frame | Short, medium, and long-term | Medium and long-term |
| Skills Required | Chart analysis | Economic and statistical analysis |
1.1. Fundamental Analysis
Fundamental analysis involves evaluating a country’s economic well-being. In other words, it is the assessment of their currency. Forex traders who use fundamental analysis will rely on various data points to determine the strength of a specific currency.
Fundamental traders will analyze inflation, trade balance, Gross Domestic Product (GDP), employment rates, and even the interest rates of the country’s central bank.
Here is an example of an economic calendar where fundamental traders can follow daily with the latest data. There is a lot of data every day, which is why traders should know how to filter the ForexFactory economic calendar to view the relevant information.

By evaluating the related trends of this point and other data points, traders assess the relative strength of the economy and decide whether or not to trade the currency of that country in the future.
The table below summarizes common impacts that economic data have in relation to currency strength. However, it cannot be guaranteed with certainty, as many other factors also affect economic fluctuations.
How economic data impacts currency:
| Economic Data | Expectation | Impact on Currency |
|---|---|---|
| GDP | Higher than expected | Positive |
| CPI | Higher than expected | Positive (*) |
| Trade Balance | Trade deficit (imports exceed exports) | Negative |
| Central Bank Interest Rate | Interest rate increase | Positive |
| Manufacturing Index | Higher than expected | Positive |
| Producer Price Index | Higher than expected | Positive |
(*) Developed countries allow moderate inflation as a sign of a growing economy. Developing countries see rising or stable inflation as a positive statistic because it helps control price levels.
1.2. Technical Analysis
Technical analysis involves reviewing data on price charts. Technical traders look for patterns such as triangle patterns, flag patterns, double bottom patterns. Based on these patterns, a trader will consider the open and close points. Unlike fundamental traders, a technical trader is not concerned with why certain factors impact trends, but rather focuses on the patterns on the charts.
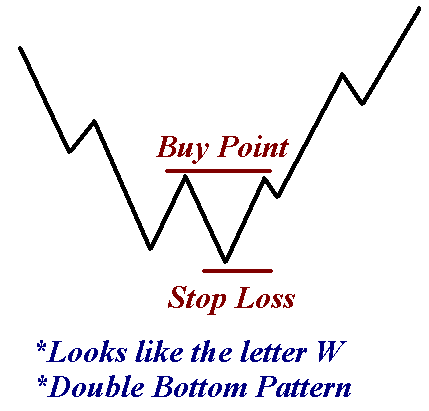
Below is an example of a pattern – the double bottom pattern. The market initially trends downward, then slightly reverses before beginning a new downward trend, and later reverses to rise.
A technical analyst will look for ways to set the stop-loss level at the nearest point (lowest) and wait for the market to create a higher high and a lower low before placing a buy order.
Example of Technical Analysis:
In practice, a technical trader needs to identify patterns. For example, the chart below shows a pattern resembling the letter W.
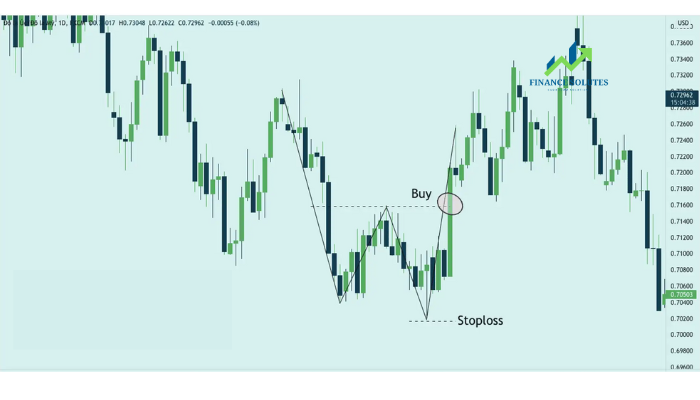
A technical Forex trader will evaluate price movements, trends, support and resistance levels observed on the chart. Many patterns used in technical analysis in the forex market can also be applied to other markets.
In addition, traders use indicators and oscillators added to the price chart when analyzing the forex market. Tools like moving averages, Bollinger Bands, MACD, Relative Strength Index (RSI), and indicators measuring momentum and price strength tend to be some of the popular tools used by technical traders. These indicators are favored by traders because they are easy to use and provide clear signals.
Benefits of Technical Analysis:
Technical analysis is not “witchcraft” as some traditionalists claim. Starting with technical analysis can be done by assessing the direction and strength of trends. Traders use trend analysis to help them identify which currency pairs to trade and the trends to trade them in.
Here is an example of how a technical trader might observe that the Australian Dollar is highly correlated with the weakening of the Euro. This is why the currency pair is trending downward. Moreover, it is clear that the pair is trading in a strong downward direction. This is considered a trend, and traders use key levels, support and resistance zones, and indicators to identify trends quickly and accurately.
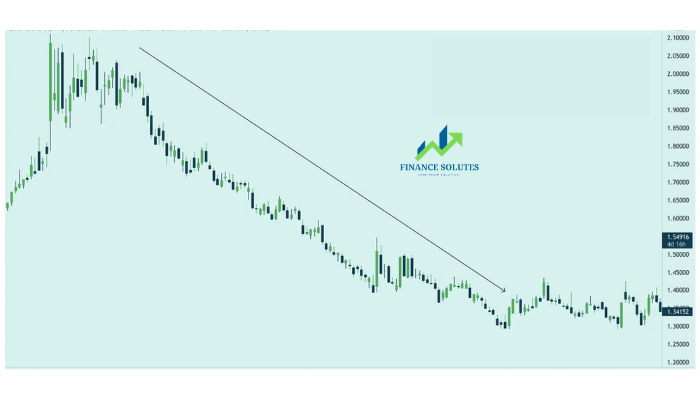
Identifying strong and weak currencies will provide traders with an indicator of which currency pairs are most likely to trend. This helps traders make decisions that lead to higher probability trades. A trader would trade in a specific direction by selling the EUR/AUD pair.
2. SUMMARY
Fundamental analysis and technical analysis in forex are two different strategies, with distinct approaches to trading. They offer unique values and insights that assist in making trading decisions, such as when to enter and when to close a trade. While some traders prefer to use each type of analysis separately, based on their trading style and goals, others combine both methods. The combination of both fundamental and technical analysis offers many benefits.
- t.me/finance_solutes
- Website: https://finance-solutes.com
- Hotline: +1 929 5636 439 ( Hotline )
- 26 Broadway, Suite 934, New York, 10004, US
