
 XM
XM Bybit
Bybit Binance
 Robinhood
 Webull
 IC Markets
 Pepperstone
 OKX
OKX Vantage
 VT Markets
 BingX
BingX Gate.io
 Kucoin
 MEXC
MEXC Exness
 Bitget
Ichimoku (or Ichimoku Kinko Hyo) – a highly complex indicator. This is a useful indicator not only for evaluating different markets but also for forex trading. It is well-known that forex trading involves both profits and losses. However, this unique strategy provides trading signals that are distinctly different in quality. Today’s article will analyze how to effectively use the Ichimoku trading system when trading Forex.
1. OVERVIEW OF THE ICHIMOKU INDICATOR
What is Ichimoku or Ichimoku Cloud? It is a technical indicator used to evaluate momentum in the market while predicting future resistance and support levels. Ichimoku Cloud, fully known as Ichimoku Kinko Hyo, was developed by a Japanese journalist and reporter.
The Ichimoku Cloud is composed of five components: Tenkan-Sen (Conversion Line), Kijun-Sen (Base Line), Chikou Span (Lagging Line), Senkou-Span A (Leading A), Senkou-Span B (Leading B), and Kumo Cloud. The Kumo Cloud is formed by the two lines, Senkou-Span A and Senkou-Span B.
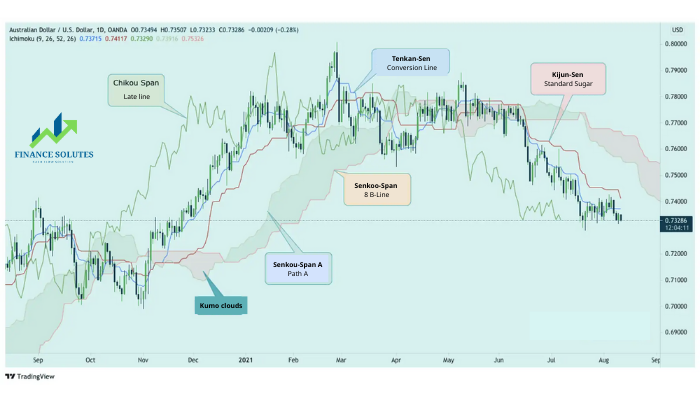
At first glance, traders may feel overwhelmed by the complex appearance of this indicator. However, once they understand its meaning, components, and how to use Ichimoku in forex trading, that initial feeling of overwhelm will gradually fade away.
1.1. Meaning of Ichimoku
In Japanese, Ichimoku means “at a glance,” implying that when using Ichimoku, traders only need to look at the Ichimoku chart system once to identify momentum, resistance, and support levels.
Ichimoku Kinko Hyo is translated as “balance chart in an instant,” and is sometimes also referred to as the “cloud chart in an instant” because of the unique Kumo Cloud that forms on the Ichimoku chart.
The Ichimoku chart is a system for determining trends based on moving averages. Moreover, because it contains more data points than a standard candlestick chart, it provides a more comprehensive view of potential price action.
The key difference between how the moving averages are drawn in Ichimoku and other methods is that Ichimoku’s moving averages are based on the average of the highest and lowest prices, unlike others that use only the closing price of the candle. Ichimoku Cloud also considers time as an additional factor alongside price action.
2. ICHIMOKU AND SUPPORT/RESISTANCE LEVELS
As mentioned above, one of the great applications of the Ichimoku Cloud is identifying potential support and resistance levels. An interesting point is that all components that make up this indicator can do so.
2.1. Support and Resistance Levels from Kijun-Sen and Tenkan-Sen
In the previous article about Ichimoku Cloud, Finance Solutes discussed how to calculate the two components, Kijun-Sen and Tenkan-Sen. Kijun-Sen is considered the slow moving average, while Tenkan-Sen is the fast moving average.
When the price is above the Kijun-Sen line, it means the price is above the average point, and thus, short-term momentum is increasing. This is further confirmed when the Kijun-Sen line slopes upward. When the market has a clear trend, the Kijun-Sen line acts as a strong support or resistance level.
– Uptrend: Kijun-Sen is a support level
– Downtrend: Kijun-Sen is a resistance level
Let’s take a look at the illustration below when the market is in a strong uptrend.
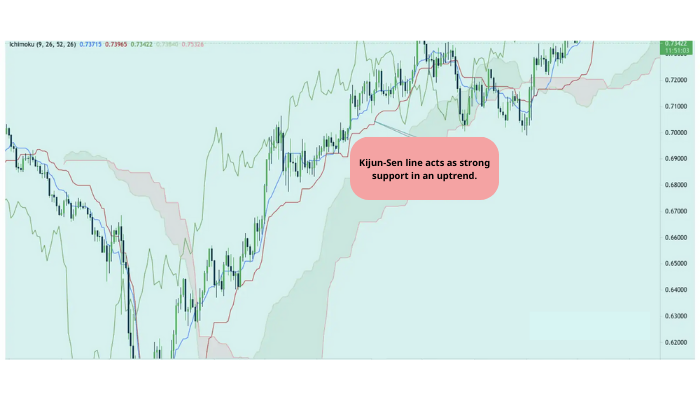
Looking at the image above, we can clearly see the strong support role of the Kijun-Sen line in a strong uptrend. The price repeatedly touches the Kijun-Sen line before bouncing back up.
Tenkan-Sen is the fastest moving line among the Ichimoku components. This line follows the price closely and can identify support and resistance levels; however, its accuracy rate is not high due to its short cycle and tight proximity to the price. Nevertheless, this does not make it useless. When combined with Kijun-Sen, Tenkan-Sen creates a strong support or resistance zone, especially when the market shows a clear uptrend or downtrend.
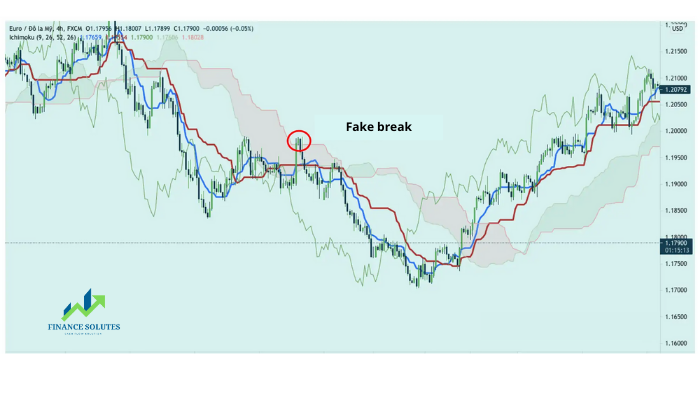
Looking at the image above, we can see that in a strong downtrend, when the price enters the area created by the Kijun-Sen and Tenkan-Sen lines (crossing above the Tenkan-Sen line but not through the Kijun-Sen line), it reverses, and the downtrend continues.
2.2. Comprehensive Support and Resistance from the Kumo Cloud
The price levels at the top or bottom of the Kumo Cloud are significant resistance or support zones. In other words, these are strong support and resistance areas where the price tends to react strongly.
The sideways frequency of the Senkou-Span B line is higher because this line is calculated using a longer cycle than the Kijun-Sen line. The sideways movement of Senkou-Span B acts as an important support and resistance level, and the resistance will be stronger when the sideways period is longer.
The price volatility is represented by the thickness of the Kumo Cloud. The thicker the Kumo Cloud, the stronger the resistance.
Let’s look at the example below:
Looking at the image above, it is clear that the market is in a strong trend. In a downtrend, the price almost always moves below the Kumo Cloud. When it touches the Kumo Cloud, the price reverses and continues to decline. There is one instance where the price breaks out of the Kumo Cloud but then continues to move downward because the downward trend is too strong. Similarly, the price moves almost entirely above the Kumo Cloud during an uptrend.
From this, we can also use the Kumo Cloud as an indicator to determine the market trend as follows:
– When the price moves below the Kumo Cloud => The market is in a downtrend
– When the price moves above the Kumo Cloud => The market is in an uptrend
3. FOREX TRADING STRATEGY WITH ICHIMOKU
By now, you may have a better understanding of the components of the Ichimoku trading system, its calculation formula, and the meaning of the Ichimoku Cloud. You may also be wondering how to use the Ichimoku Cloud to build an effective forex trading strategy. This is the main goal of this article.
First, it’s important to remember that, even after understanding the Ichimoku indicator better and feeling that it’s simpler, it is still an advanced tool in technical analysis.
3.1. Crossover Strategy
The trend-following strategy, also known as the crossover strategy, is a popular Ichimoku trading strategy that uses the Kumo Cloud and the crossing of the two base lines and the lagging line to identify market reversal points. It’s popular because of its high probability of profitability.
3.1.1. Tenkan-Sen Crossing Kijun-Sen
When the Tenkan-Sen line crosses the Kijun-Sen line, there are two trading ideas:
– Enter a buy position when the Tenkan-Sen line crosses above the Kijun-Sen line.
– Conversely, enter a sell position when the Tenkan-Sen line crosses below the Kijun-Sen line.
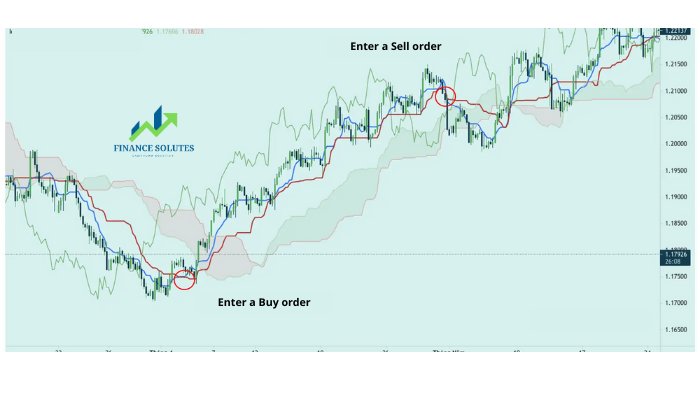
However, the crossing of these two lines in the market is not rare; in fact, it happens quite often. In the example above, we can see that the Tenkan-Sen and Kijun-Sen lines cross each other several times. Therefore, crossovers can sometimes provide false signals.
For this reason, beginners who lack experience should trade based on the Ichimoku strategy in the direction of the trend. This means that if the market is in a downtrend, only wait for the two lines to cross in an upward direction to enter a buy position. Conversely, if the market is in an uptrend, wait for the Tenkan-Sen to cross below the Kijun-Sen and enter a sell position.
Additionally, the Ichimoku strategy will be more effective when combined with additional confirming signals:
– When the price is above the Kumo Cloud, and the Chikou Span is above the price line (the further, the better), the uptrend is confirmed.
– Conversely, when the Chikou Span is below the price line and the Kumo Cloud is above the price, the downtrend is confirmed.
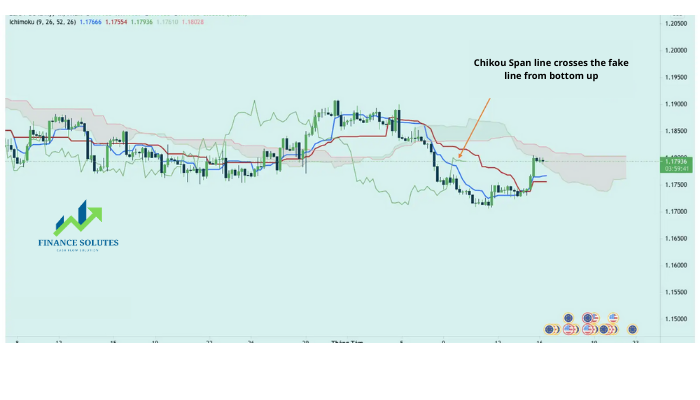
3.1.2. Chikou Span Crossing the Price Line
When the Chikou Span line crosses the price line, there are two trading ideas:
– When the Chikou Span crosses from above to below the price line → Enter a sell position
– When the Chikou Span crosses from below to above the price line → Enter a buy position
As mentioned in the previous article, you may already know that the Chikou Span is a lagging line, so it moves 26 periods behind the price line.
3.1.3. Cloud Color Change or Senkou-Span A Crossing Senkou-Span B
Senkou-Span A and Senkou-Span B are plotted 26 periods ahead, so unlike the Chikou-Span, you will see the Kumo Cloud, or the two lines Senkou-Span A and Senkou-Span B, lead the price.
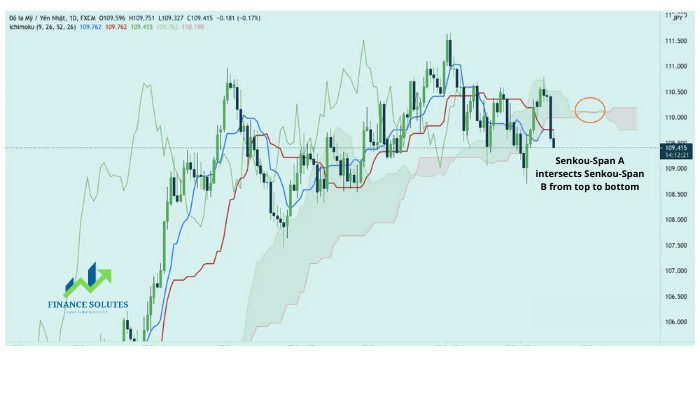
Here are two trading ideas that will arise:
- When the cloud changes from red to green, meaning Senkou Span A crosses Senkou Span B from below, execute a buy trade.
- On the contrary, when the cloud changes from green to red, or when Senkou Span A crosses Senkou Span B from above, execute a sell trade.
Note: The Kumo cloud here refers to the future Kumo cloud (ahead of the price); it is not the Kumo cloud that is parallel to the price.
3.2. Strategy Combining Ichimoku Cloud Elements
The Ichimoku cloud itself can create a complete trading system, as the components that make up the Ichimoku cloud already provide trading signals. Moreover, when combining these components together, a complete trading system is formed, without needing any additional methods or tools.
Everything can be summarized in the following points:
- The Ichimoku trading system works best when the market has a clear trend; it does not perform well when the price is in a consolidation phase.
- Use the Kumo cloud to identify the market trend. If the price moves below the Kumo cloud, the trend is bearish, and vice versa.
- Enter a Buy trade when the Tenkan-sen crosses the Kijun-sen from below, and the Chikou Span crosses from above.
- Conversely, enter a Sell trade when the Tenkan-sen crosses the Kijun-sen from above, and the Chikou Span crosses from below.
4. SUMMARY
Ichimoku Kinko Hyo is considered to be one of the most advanced and complete indicators. If you can understand and apply Forex knowledge well, traders can use this indicator without needing any additional tools or methods.
However, if any trader asks whether this indicator is the “holy grail,” the answer is no. You must understand that the Forex market always involves risk; no method, trading system, or indicator is considered a “holy grail.” I hope what this article shares can help you understand more about the Ichimoku trading system and how to apply Ichimoku strategies in Forex trading.
Wish you success!
- t.me/finance_solutes
- Website: https://finance-solutes.com
- Hotline: +1 929 5636 439 ( Hotline )
- 26 Broadway, Suite 934, New York, 10004, US
