
 XM
XM Bybit
Bybit Binance
 Robinhood
 Webull
 IC Markets
 Pepperstone
 OKX
OKX Vantage
 VT Markets
 BingX
BingX Gate.io
 Kucoin
 MEXC
MEXC Exness
 Bitget
The Cup and Handle pattern occurs frequently in the financial markets. Integrating this pattern into a trading system can enhance a trader’s ability to analyze the market more effectively. So, what exactly is the Cup and Handle pattern? And how can it be traded in the forex market? Let’s explore this together with Finance Solutes in the article below.
Let’s get started!
1. WHAT IS THE CUP AND HANDLE PATTERN?
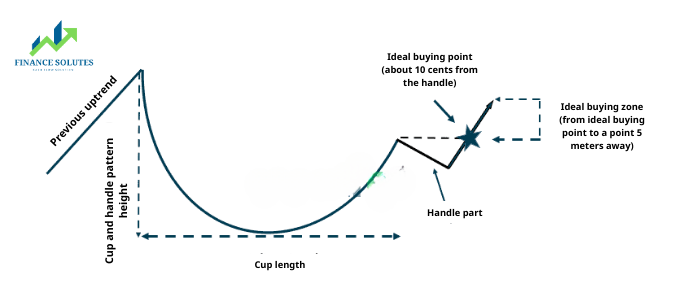
The Cup and Handle pattern is a trend continuation pattern that appears after a prior upward or downward trend. Its formation provides traders with several distinct signals. The term “Cup and Handle” originates from the bar chart’s visual structure: the cup resembles a rounded bowl, while the handle is depicted as a short, downward-sloping consolidation phase.
2. HOW TO IDENTIFY THE CUP AND HANDLE PATTERN
The Cup and Handle pattern can be more complex than other chart patterns, making it difficult for some traders to identify. Below are simple steps to help you successfully identify this chart pattern:
- Identify the previous uptrend: The Cup and Handle pattern is considered a bullish continuation pattern, so it’s essential to confirm that there was an upward trend beforehand. This can be done using price action techniques or technical indicators, such as moving averages.
- The cup should have a U-shape: A U-shaped cup is preferred over a V-shape, with the highest price levels on both sides of the cup being relatively similar.
- The handle represents a consolidation: The handle typically forms as a consolidation phase, often in the shape of a rectangle or triangle. This handle will slope downward, but in some cases, it can accumulate sideways, resembling a Rectangle pattern.
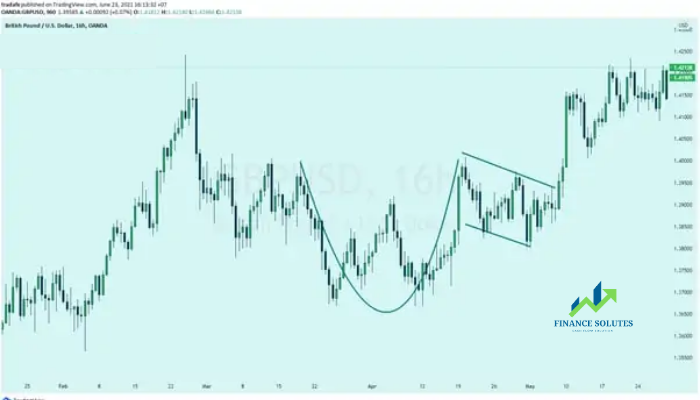
- Breakout signals: Breakouts can occur in several ways, depending on the trader’s preferences. Some traders look at the resistance level, which is taken from the horizontal line drawn between the high points of the cup. When the price breaks above this level, it confirms the entry point. Other traders may use the trendline break of the handle as their buy entry point.
3. HOW TO TRADE THE CUP AND HANDLE PATTERN
Trading with the Cup and Handle pattern differs when trading forex and stocks. The volume aspect is often used in stock trading, as a sudden increase in volume during the breakout signals confirmation for entry.
In forex trading, the volume feature is typically not utilized, and instead, traders rely on traditional methods of confirming a breakout, such as a break above resistance levels. The rest of the process remains the same as when trading with the Cup and Handle pattern.
3.1. Trading Stocks with the Cup and Handle Pattern
For instance, let’s consider Wynn Resorts Ltd. as an example:
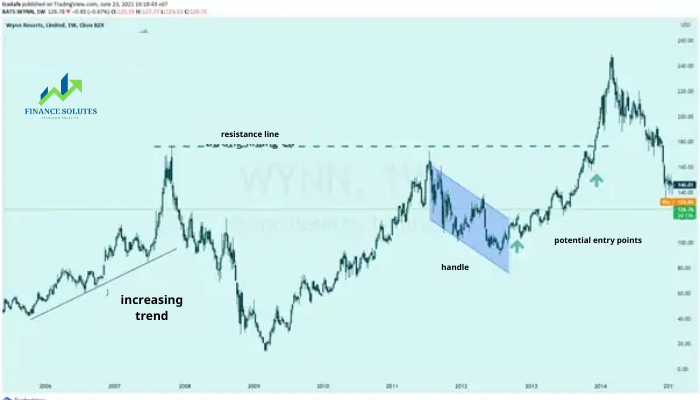
The image above is a monthly chart of the famous casino and hotel company Wynn Resorts Ltd. The chart shows the formation of a Cup and Handle pattern with a prior uptrend; this trend is marked by a trendline connecting higher highs and higher lows. Alternatively, a moving average line can also be used to confirm the uptrend.
The chart displays two potential entry points, illustrated with green arrows. The first entry point occurs on the breakout above the top of the price channel, which resembles a bullish flag, with a surge in trading volume confirming the breakout. The second entry point uses the resistance level between the two highs on either side of the cup as a key price level. Once this price level is broken, traders may look to enter a buy order. This method may seem less efficient; however, waiting patiently for additional confirmation can protect you against false breakouts related to the handle’s price channel.
The stop-loss level is typically placed at the lowest point of the handle. Then, this level can be multiplied by a factor of two to obtain a take-profit target with a risk:reward ratio of 1:2. Some other traders prefer to use Fibonacci extensions as a benchmark for setting profit targets. The choice depends on the trader’s personal preference.
3.2. Trading Forex with the Cup and Handle Pattern
Example of the EUR/USD forex pair:
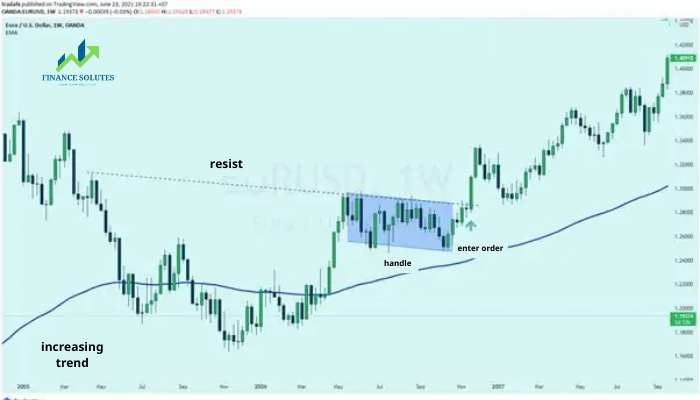
The formation of the Cup and Handle pattern on the weekly chart of the EUR/USD pair above shows a potential buying opportunity.
In this example, a moving average is used to identify the prior uptrend (price is above the 100-day moving average).
This chart is unique in that the resistance level between the two highs on either side of the cup and the handle’s price channel coincide. This provides traders with an entry point since a breakout above both resistance levels is essentially the same. Stop-loss and take-profit levels are determined in the same way as mentioned in the stock example. The only difference on the forex chart is the lack of volume tools.
4. PROS/CONS OF THE CUP AND HANDLE PATTERN
| Pros | Cons |
| – Easy to identify for more experienced traders – The Cup and Handle pattern can be used in both the stock and forex markets – Stop-loss and take-profit levels are easy to determine |
– May be difficult to identify for beginner traders – Often requires additional confirmation from technical indicators – The Cup and Handle pattern may take longer to trade |
5. CONCLUSION
Through today’s article, Finance Solutes has introduced you to what the Cup and Handle pattern is; how to recognize it on a forex chart as well as how to trade effectively using this popular pattern. We hope the knowledge we’ve shared will support you in your forex trading and investing journey.
Wishing you success in your trading career!!!
- t.me/finance_solutes
- Website: https://finance-solutes.com
- Hotline: +1 929 5636 439 ( Hotline )
- 26 Broadway, Suite 934, New York, 10004, US
