
 XM
XM Bybit
Bybit Binance
 Robinhood
 Webull
 IC Markets
 Pepperstone
 OKX
OKX Vantage
 VT Markets
 BingX
BingX Gate.io
 Kucoin
 MEXC
MEXC Exness
 Bitget
The Heiken Ashi indicator, or Heiken Ashi candles, is one of the technical tools developed decades ago to interpret candlestick formations. This tool has been studied for centuries, starting with rice traders in Japan. Heiken Ashi candles are believed to eliminate the “noise” found in traditional Japanese candlestick charts and function similarly to a moving average. So, what is a Heiken Ashi candle? How do you trade using Heiken Ashi candles? Let’s explore in detail with Finance Solutes through the following series of forex knowledge articles.
Let’s get started!!!
1. HEIKEN ASHI INDICATOR
Heikin-Ashi, sometimes also written as Heiken-Ashi, means “average bar” or “average candle” in Japanese, as its price levels are related to average values. The Heikin-Ashi technique can be used in conjunction with candlestick charts when trading stocks to detect market trends and predict future prices. It helps make candlestick charts easier to read and trends easier to analyze.
Heiken Ashi candles, also commonly spelled Heikin Ashi, were developed by Munehisa Homma in the 1700s.
1.1. What is a Heiken Ashi candle?
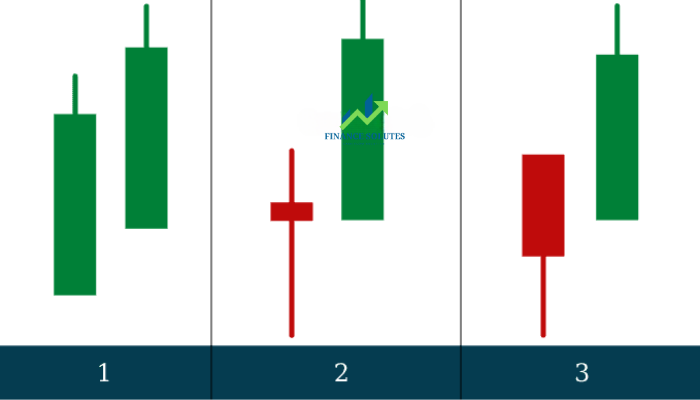
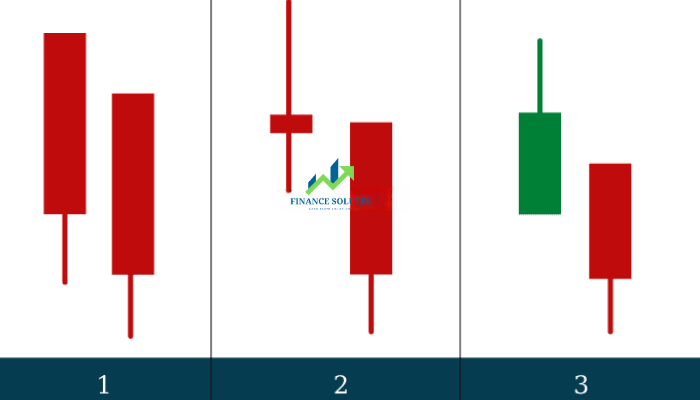
Similar to the traditional Japanese candlestick pattern you usually see, the Heiken Ashi pattern also features a body and two wicks (shadows). It also has four price levels: high, low, open, and close — but the calculation for these prices is significantly more complex.
The price levels of a traditional Japanese candlestick are determined from the trading session that forms the candle. However, slightly different in the case of the Heiken Ashi pattern, these four price levels also depend on the price data from the previous trading session.
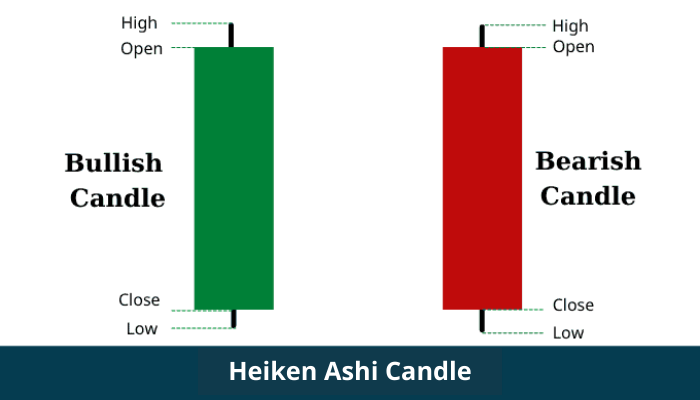
1.2. How to Read Heiken Ashi Candles (How to View a Heiken Ashi Chart)
So, what is the formula for calculating the price levels of a Heiken Ashi candle?
Open price is the average of the open and close prices of the previous trading session (previous candle):
- Open = (Open of Previous Bar + Close of Previous Bar) / 2
Close price is the average of the four price levels (open, close, high, and low) of the current trading session:
- Close = (Open + Close + High + Low) / 4
High price is the maximum value among the open, close, and the highest price reached during the current session:
- High = Max (High, Open, Close)
Low price is the minimum value among the open, close, and the lowest price reached during the current session:
- Low = Min (Low, Open, Close)
1.3. Heiken Ashi Candles Compared to Japanese Candlesticks
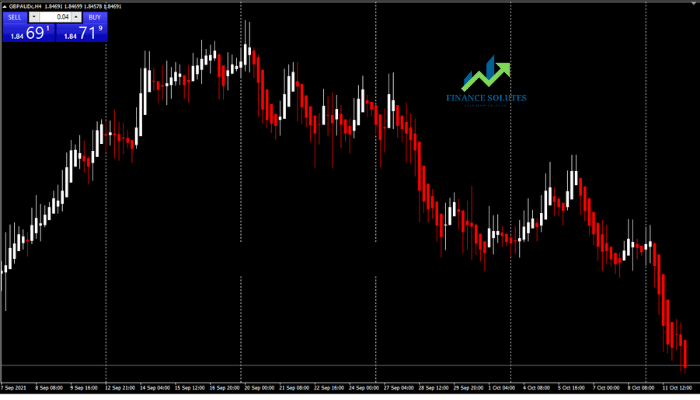
To compare a Heiken Ashi chart with a traditional Japanese candlestick chart, you can refer to the example below: EUR/USD pair on the Daily timeframe, within the same period.
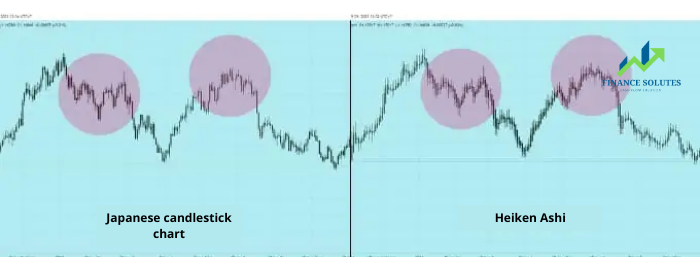
The first noticeable difference is that the Heiken Ashi chart appears fuller, thicker, and more closely packed compared to the traditional Japanese candlestick chart. This is because in standard Japanese candlestick charts, the opening price of the next session is usually equal to the closing price of the previous session (unless a GAP appears); the candles are connected from wick to wick. In contrast, with Heiken Ashi, the next candle starts approximately in the middle of the previous one, so GAPs never appear on a Heiken Ashi chart. This is a key feature that distinguishes Japanese candlestick charts from Heiken Ashi charts.
Next, in terms of price movement trends, both charts reflect a similar direction, but the Heiken Ashi chart appears smoother than the Japanese candlestick chart.
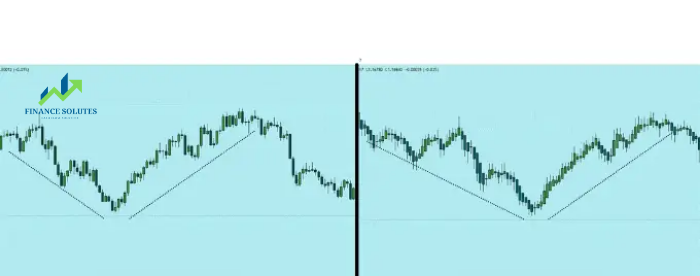
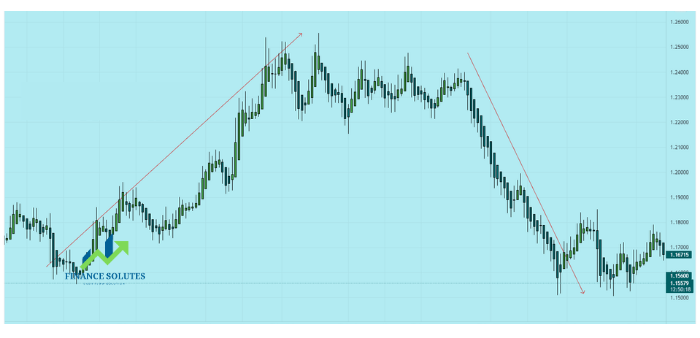
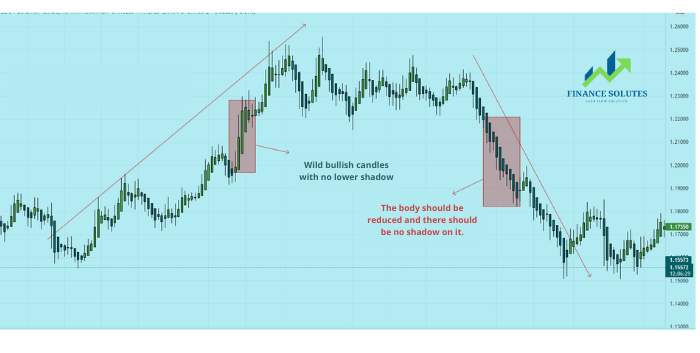
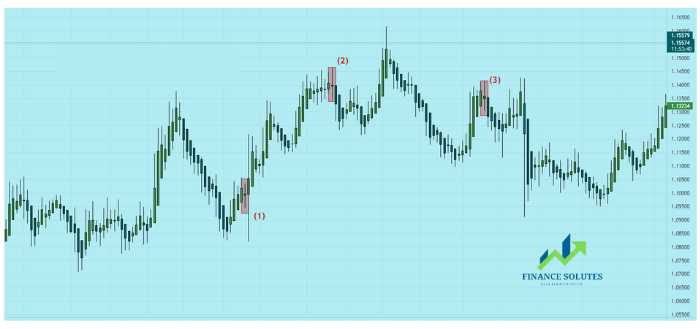
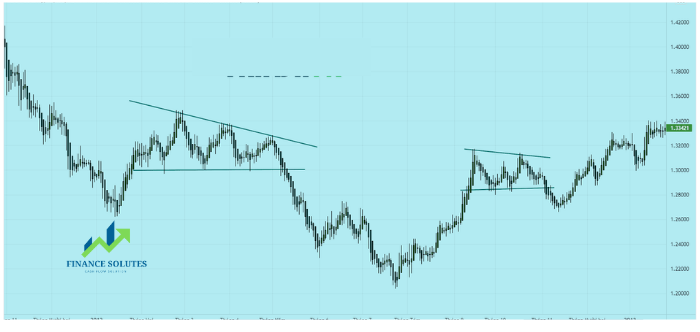
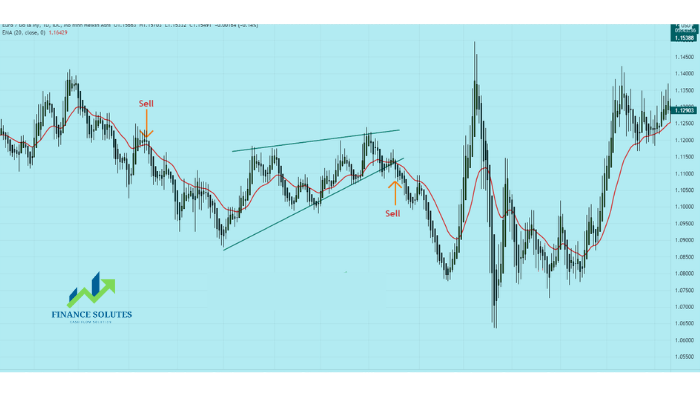
In the two trend segments—downtrend and uptrend—highlighted in the image below, the Heiken Ashi chart shows the downtrend with mostly bearish candles (blue) and the uptrend with mostly bullish candles (green). Meanwhile, on the traditional Japanese candlestick chart, the downtrend still includes some bullish candles, and the uptrend still includes some bearish candles.
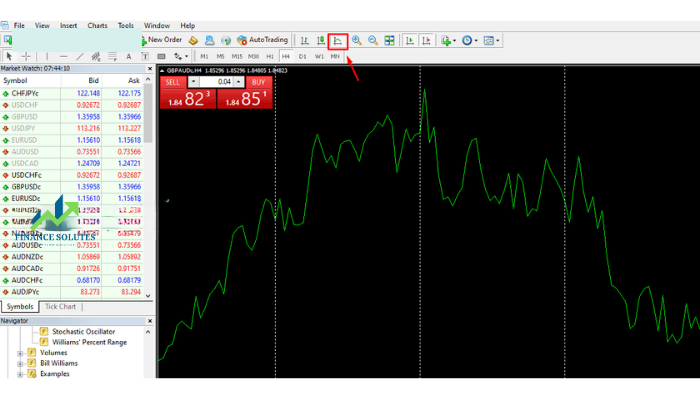
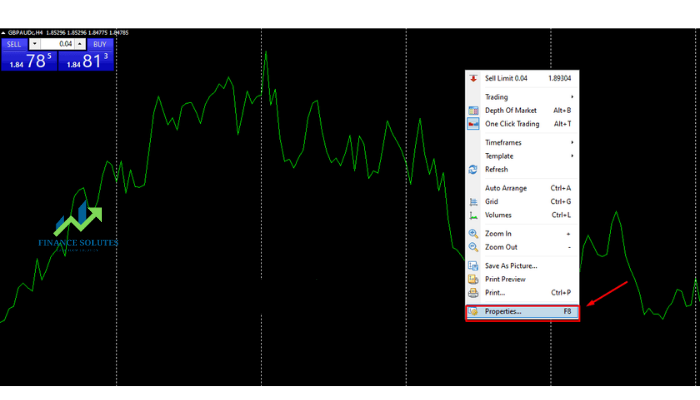
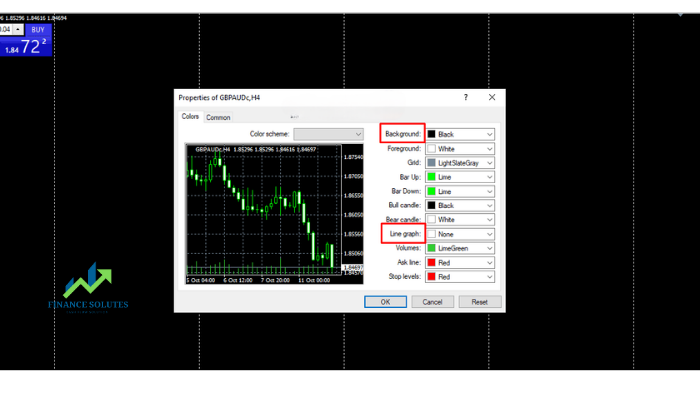
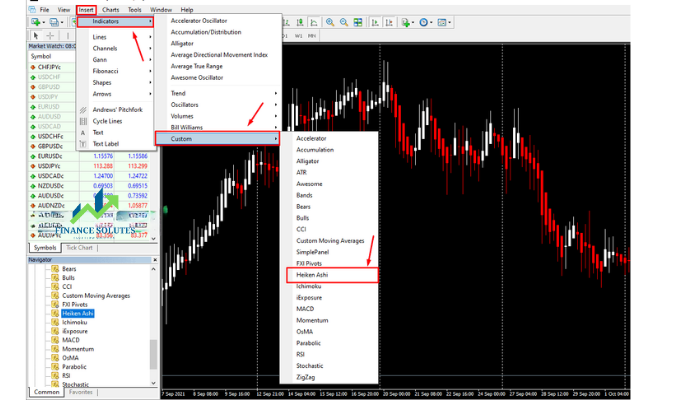
- t.me/finance_solutes
- Website: https://finance-solutes.com
- Hotline: +1 929 5636 439 ( Hotline )
- 26 Broadway, Suite 934, New York, 10004, US
