
 XM
XM Bybit
Bybit Binance
 Robinhood
 Webull
 IC Markets
 Pepperstone
 OKX
OKX Vantage
 VT Markets
 BingX
BingX Gate.io
 Kucoin
 MEXC
MEXC Exness
 Bitget
ROC Indicator – one of the advanced indicators that professional traders are extremely fond of – can be applied not only in forex but also proves useful across other financial markets. In today’s article, we’ll discuss what the ROC indicator is, the formula to calculate it, and how to trade using this advanced tool!
1. WHAT IS ROC IN FINANCE?
ROC stands for many common terms such as the Republic of China or Regional Operations Center, etc. However, in finance, ROC stands for Rate of Change. Let’s explore the meaning of this term in the first section of the article.
1.1. What is the ROC Indicator?
The ROC indicator (Rate of Change) is a price rate of change indicator – a technical indicator belonging to the momentum indicators group. It is used to measure the percentage change between the current price and the price at a certain period in the past.
On the ROC indicator chart in TradingView, a line oscillates above and below the 0 line. Looking at the illustration, you can see that ROC vs RSI are quite similar, both are oscillating lines around the 0 line.
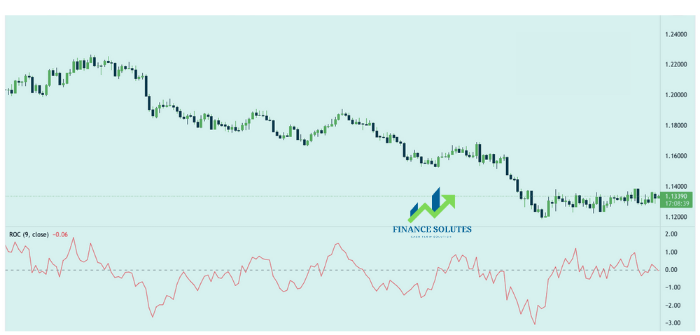
When momentum increases, the ROC indicator moves from a negative value upwards above the 0 line. Conversely, when the momentum changes and decreases, the ROC line moves from a positive value downwards below the 0 line.
1.2. ROC Formula
Here is the formula to calculate the ROC indicator:
[(Current price/Price n periods ago) – 1] x 100
The price used in this formula is the closing price.
n: number of periods. Typically, the default setting for the ROC indicator in TradingView is 9, while the default setting in MT4 is 10.
Traders can customize the ROC indicator’s settings and choose the most suitable period. There is no perfect, universal number for every strategy. The key is to analyze other factors and experiment to select the most appropriate period.
However, price volatility or fluctuation is the most important factor. Using too small a period may cause signals from price data to be inaccurate, while too large a period may result in delayed data.
ROC can result in either a negative or positive value. The idea behind this formula is to use both current and past price levels to provide traders with insights into the momentum being analyzed.
2. HOW TO SET UP ROC INDICATOR ON MT4?
The ROC indicator is available in TradingView, and traders can add it to the chart just like other technical indicators.
However, MT4 does not have the ROC indicator integrated. Therefore, traders need to manually install the ROC indicator on MT4 to use it. (Download link for the free ROC indicator for MT4, from Tradafx, is provided at the end of the article). Below is a guide on how to set up the ROC indicator.
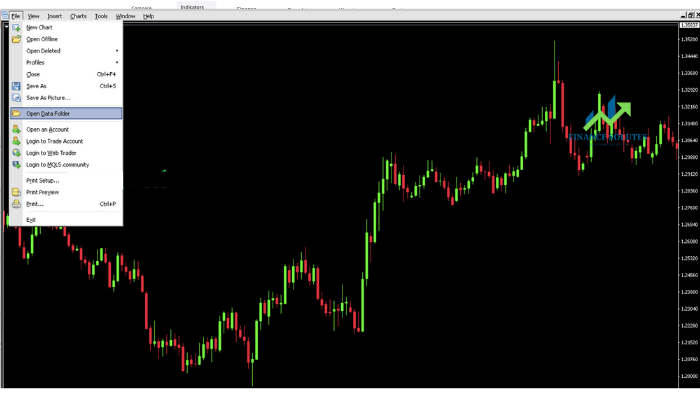
After downloading the indicator, extract the file you just downloaded. Open the MT4 software, then go to File -> Open Data Folder:
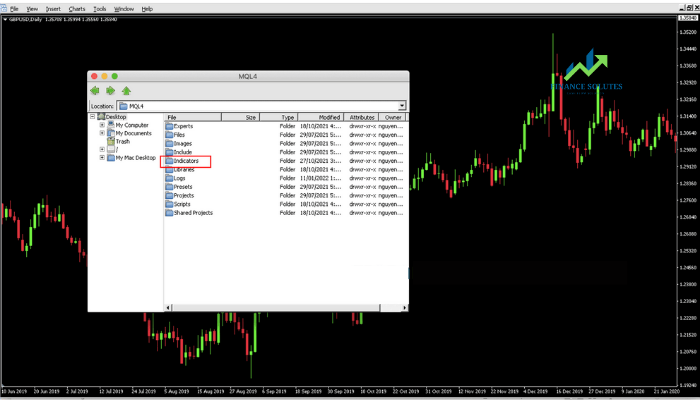
Immediately after opening, the MQL4 file can be easily seen:
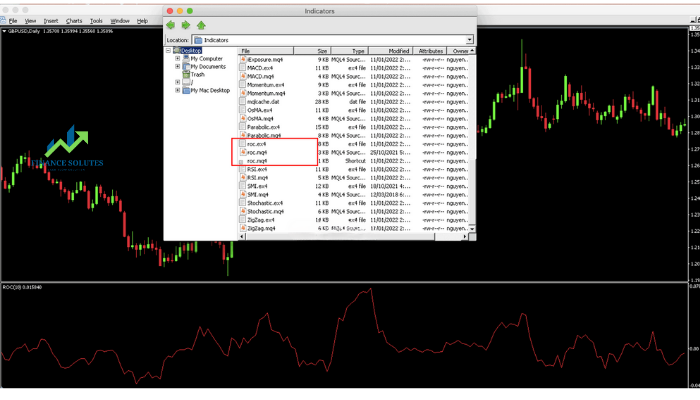
Click M4 -> Select Indicators -> Copy the .mq4 file and paste it into the Indicators file:
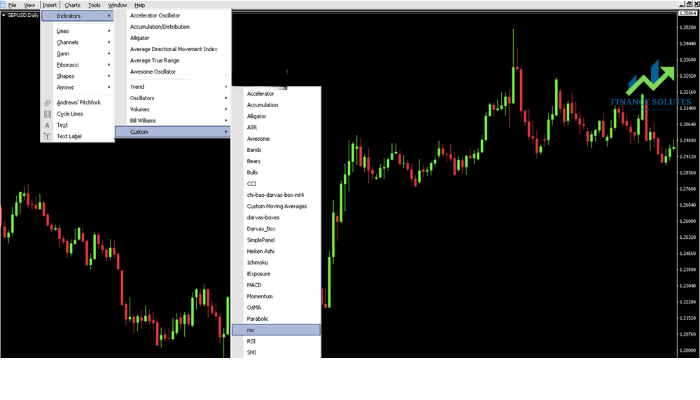
Close and reopen MT4. You can find the MT4 ROC indicator in the Custom section of Indicators:
3. HOW TO USE THE ROC INDICATOR
The ROC indicator can be used to confirm price movements and identify divergence signals. Additionally, the ROC indicator can be used as a directional indicator to determine overbought and oversold conditions. The rate of price change measured by the indicator can be used in several ways.
3.1. Trading Rules with the Advanced ROC Indicator
Here are some trading rules on how to use the ROC indicator.
– When the ROC is above the 0 line and continues to rise => Bullish trend, with accelerating momentum.
– When the ROC is above the 0 line but is gradually sloping down => The rate of the bullish trend is slowing down.
– When the ROC is above the 0 line and exceeds the previous peak => The bullish trend is continuing with strong momentum.
– The opposite of the above rules applies when the ROC indicator is below the 0 line.
3.2. ROC Indicator Trading Strategy
After reading the trading rules above, you may have an idea of how to trade with the ROC indicator.
3.2.1. Identifying the Trend
Typically, oscillators are used in range-bound or unclear market trends, but the ROC indicator can also be used to identify the overall trend in the market.
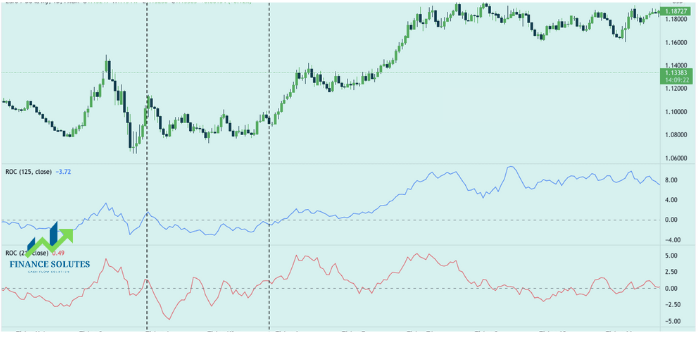
The trend reversal can be clearly observed in lower cycles. For example, by combining the ROC indicator with a 21-period cycle and a 125-period cycle. In the illustration above, after a sideways period (marked by two dashed lines), the ROC indicator gradually oscillates above the 0 line.
Traders can clearly see that the 21-period ROC indicator crosses above the 0 line before the 125-period ROC indicator. As mentioned in the ROC formula section, the higher the number of periods selected, the later the data will be displayed.
When viewing the chart and noticing that the ROC indicator is gradually changing direction, indicating a slowdown in the trend continuation, it is important to exercise caution and manage the risk of your positions accordingly.
3.2.2. Overbought/Oversold Signals and Divergence
Oscillators help traders easily identify extreme levels (highest and lowest prices) and reversal points.
Both ROC and RSI can be used to identify overbought and oversold areas. However, unlike the RSI, which uses the 30 and 70 lines as reference points, the overbought/oversold levels for ROC are not fixed and vary depending on the asset and market conditions.
When the ROC continuously rises, it indicates strong buying activity, pushing the price higher, causing the ROC indicator to enter the overbought region, and vice versa.
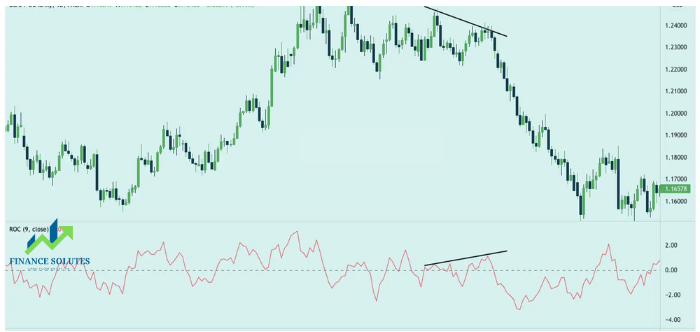
The illustration above shows a divergence signal on the EUR/USD pair. After a sideways period, the price starts creating lower highs, but the ROC indicator shows a higher high. Similar to other oscillators, this signals that the current trend is about to reverse.
3.2.3. Limitations of the ROC Indicator
Looking at the ROC formula, traders can easily notice that both the current and past prices are weighted equally. This is a major limitation of the ROC indicator. The reason is that past price levels don’t have as significant an impact on the future. Traders can use past prices for analysis and predictions, but past prices cannot directly determine future price fluctuations.
Traders are required to research and set the appropriate parameters to effectively identify signals from the market. This limitation of the ROC indicator was mentioned earlier in the formula section.
4. CONCLUSION
The ROC indicator, as shown on the chart, is a relatively simple oscillating line. However, in practice, it is a widely used momentum indicator for traders who implement trend-following or market momentum strategies.
Like other technical indicators, the ROC is not flawless and can still give false signals. One of the most important aspects of trading with the ROC indicator is selecting the correct cycle setting.
Besides using it independently, traders can combine the ROC indicator with other technical indicators, such as ROC vs RSI, MACD, or moving averages. Whether combined or used alone, don’t forget to set stop-loss orders, prepare a trading plan, and have a proper risk management strategy!
- t.me/finance_solutes
- Website: https://finance-solutes.com
- Hotline: +1 929 5636 439 ( Hotline )
- 26 Broadway, Suite 934, New York, 10004, US
