
 XM
XM Bybit
Bybit Binance
 Robinhood
 Webull
 IC Markets
 Pepperstone
 OKX
OKX Vantage
 VT Markets
 BingX
BingX Gate.io
 Kucoin
 MEXC
MEXC Exness
 Bitget
The Accumulation Distribution (A/D) Indicator is a useful volume-based indicator adopted by many Forex traders to analyze the movement of money flow in the market. It is a technical indicator that is a variation of the OBV (On Balance Volume) indicator, involving the analysis of trading volume based on each session’s closing price.
Let’s explore in detail the concept of the Accumulation Distribution indicator and how to trade using this indicator in the following article with Finance Solutes!
WHAT IS THE ACCUMULATION DISTRIBUTION INDICATOR?
Accumulation Distribution Indicator
The Accumulation Distribution (A/D) indicator is a tool that uses two elements—trading volume and price—to analyze changes in a stock, where higher volume increases the impact of price movements.
The Accumulation Distribution indicator aims to measure and identify divergence between stock price and trading volume, enabling traders to assess the strength of a price trend. For example, a trader might observe that market prices are trending upwards, but the A/D indicator shows a decreasing value. This is a signal worth considering, as it suggests that buying volume may not be strong enough to support the price increase, indicating a potential price drop could be imminent.
You can refer to the A/D formula as follows:

The Meaning of the Accumulation Distribution Indicator
The Accumulation Distribution indicator, when presented in the form of a line chart, represents the influence of supply and demand on prices, where the A/D line can move either in the same direction or opposite to price fluctuations.
The coefficient in the calculation serves as a measure of the strength of buying or selling pressure over a specific period. This is determined by the position of the closing price within the price range, multiplied by the trading volume.
If the market price closes at the top of the range during the observed period with high trading volume, the A/D indicator will show a strong upward movement. On the other hand, if the price closes near the top of the range but with low volume, or if the volume is high but the closing price is around the midpoint of the range, the A/D indicator will not show a significant increase.
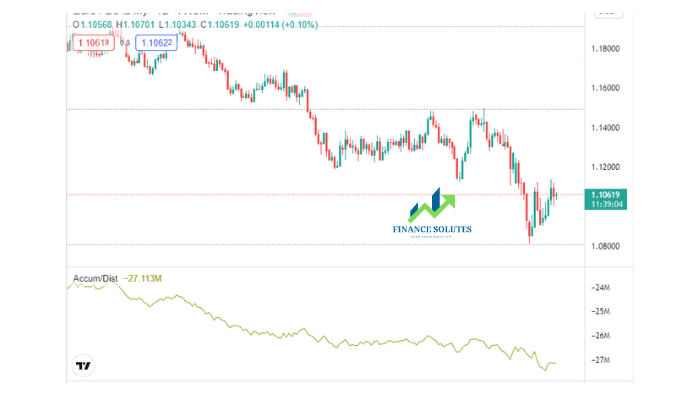
Similar layouts also apply when the closing price is at the bottom of the price range during the observed period. In this case, the trading volume and the closing price position will determine how far the A/D indicator will decrease.
TRADING WITH THE ACCUMULATION/DISTRIBUTION INDICATOR
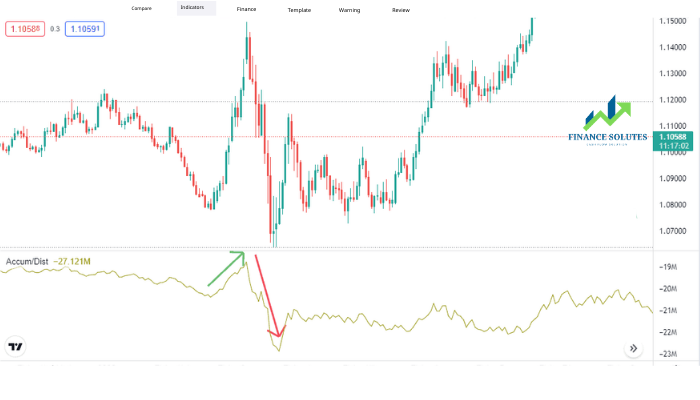
The Accumulation Distribution (A/D) indicator is not only used to assess the current price trend but also has the ability to predict potential price reversals in the future. If the market price is in a downtrend but the A/D indicator shows an upward trend, it suggests that there may be strong buying pressure, and therefore, the price may reverse and start increasing.
On the other hand, if the stock is forming an uptrend but the Accumulation Distribution indicator shows a downward trend, it indicates selling pressure or higher distribution levels, warning traders that the price may reverse and start declining.
In either case, the slope of the Accumulation Distribution indicator reveals detailed information about the price trend. A sharp increase in the A/D indicator confirms a strong price rise, while if the price is falling and the A/D indicator also confirms the decrease, the price is likely to continue decreasing in the future.
You can trade with the Accumulation Distribution indicator relatively easily by following these steps:
Step 1: Choose a chart that is trending. A market moving within a range is not an ideal environment.
Step 2: Check the default time frame being used.
Step 3: Buy when the A/D indicator moves higher, and sell when the indicator moves lower. A typical example of this is shown in the chart below.
A better option is to use the A/D indicator in conjunction with other indicators, such as combining A/D with MFI (Money Flow Index) and RSI (Relative Strength Index).
FREQUENTLY ASKED QUESTIONS
What is the difference between the Accumulation Distribution indicator and the OBV indicator?
You may already know that both are volume-based accumulation and price indicators or buy/sell pressure indicators, but they have some key differences worth noting. The OBV (On-Balance Volume) indicator primarily compares the current closing price to the previous closing price. If the current closing price is higher, the trading volume for that period is added. If the current closing price is lower, the trading volume for that period is subtracted.
On the other hand, the A/D indicator does not take into account the previous closing price and uses a coefficient based on the position of the closing price within the range of the period being analyzed. As a result, each indicator uses different formulas and may provide traders with different insights.
![VIDEO] Bạn đã hiểu rõ về giá của cổ phiếu](http://finance-solutes.com/wp-content/uploads/2025/05/thiet-ke-chua-co-ten-39-1-1715048912-width698height391.jpg)
Limitations of the Accumulation Distribution Indicator
Since the Accumulation Distribution indicator does not consider the previous closing price but instead focuses on the current price range, it may have certain drawbacks. An indicator designed to track divergence can experience prolonged periods of divergence, and sometimes the divergence between price and the indicator may not provide an accurate prediction of a price reversal.
Therefore, traders should combine the Accumulation Distribution indicator with other indicators such as price action, chart patterns, and fundamental analysis to get a more comprehensive view of the market.
SUMMARY
The article above provides a detailed explanation of the Accumulation Distribution indicator and how to trade with it. If you found this article helpful, don’t miss out on other related articles about Forex trading from Finance Solutes!
- t.me/finance_solutes
- Website: https://finance-solutes.com
- Hotline: +1 929 5636 439 ( Hotline )
- 26 Broadway, Suite 934, New York, 10004, US
