
 XM
XM Bybit
Bybit Binance
 Robinhood
 Webull
 IC Markets
 Pepperstone
 OKX
OKX Vantage
 VT Markets
 BingX
BingX Gate.io
 Kucoin
 MEXC
MEXC Exness
 Bitget
When investors want to determine whether a market is experiencing strong or weak volatility, they often rely on indicators in technical analysis. One of the typical indicators that helps traders identify trend volatility is the DMI. So what is DMI? What is the nature of the DMI indicator? How do you use this tool in trading? Let’s explore the details with Forex in today’s article.
Let’s get started!!!
1. OVERVIEW: WHAT IS THE DMI INDICATOR?
DMI stands for Directional Movement Indicator – an indicator developed by J. Welles Wilder in 1978. In fact, DMI is a combination of three indicators: ADX, DI+, and DI- combined into one. This indicator was created to determine whether a market trend exists (i.e., whether the market is experiencing strong or weak volatility). In addition, the DI+ and DI- indicators are used to complement ADX in identifying the direction of the trend.
Specifically:
-
ADX (Average Directional Index) helps investors determine the strength of a trend. ADX ranges from 0 to 100, where higher values indicate a strong upward trend and lower values indicate a strong downward trend.
-
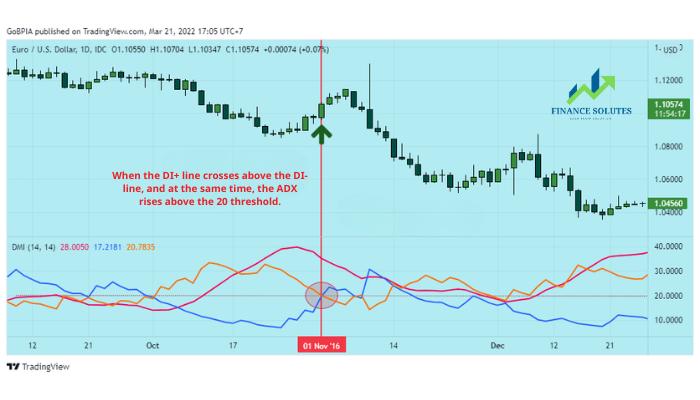
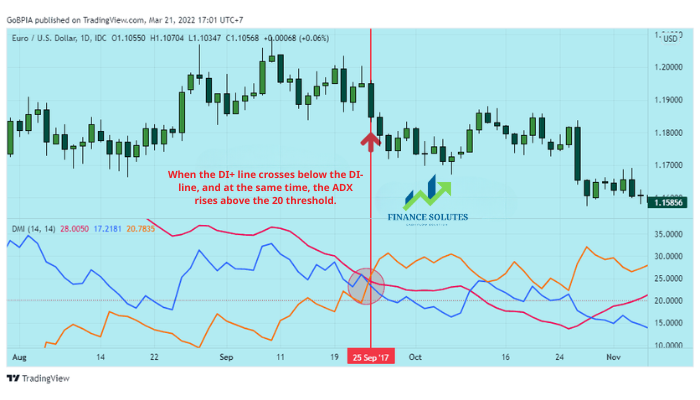
DI+ and DI- are two indicators used to determine the trend direction.
By combining these three indicators, you can clearly identify both the direction and the strength of the current trend. Therefore, DMI is used for two main purposes: determining the strength of a trend and identifying trading signals.

1.1. What is the DMI Calculation Formula?
The DMI formula is calculated by comparing today’s high and low prices to those of the previous day. From there, the indicator checks whether the price range is higher or lower and produces an average result over a defined time period. However, investors don’t need to worry about this formula, as the DMI system already includes built-in visual analysis tools. Therefore, the DMI formula is no longer crucial for traders.
1.2. Structure of the DMI Indicator
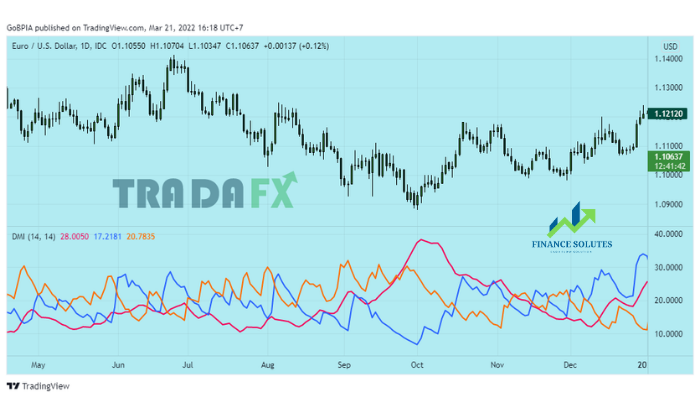
As mentioned in the previous section, DMI is a set of 3 indicators, including: Average Directional Index (ADX), Positive Directional Index (DI+) and Negative Directional Index (DI-).
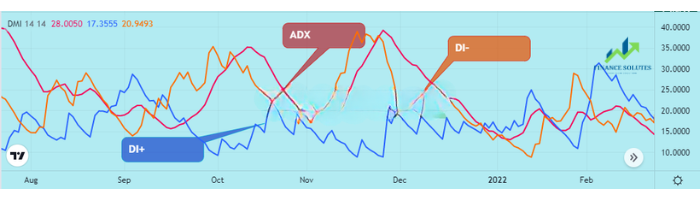
Looking at the chart above, you can see:
-
ADX line: Represented by the pink line on the chart
-
DI+ line: Represented by the green line
-
DI- line: Represented by the orange line
By default on TradingView, DMI is calculated using the 14,14 parameters.
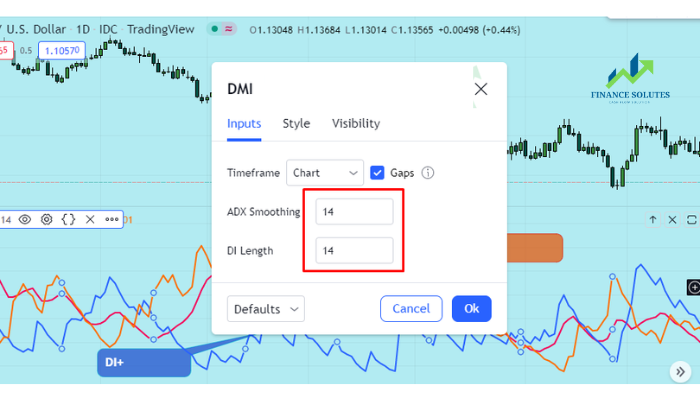
In fact, the default parameters have been thoroughly researched and are used by most traders. If you wish to change the input parameters, Finance Solutes recommends taking the time to test your strategies before making any adjustments to avoid potential risks in trading.
2. THE NATURE OF THE DMI INDICATORS
Let’s take a closer look at the nature of DMI through the indicators that make it up.
2.1. ADX Line
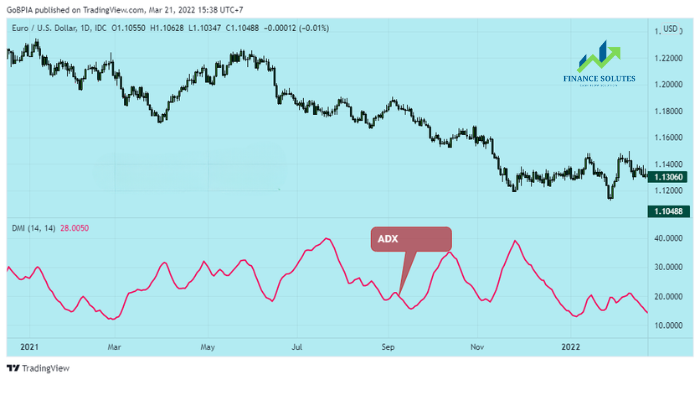
ADX helps investors determine whether the market is experiencing strong or weak volatility. This indicator has three key thresholds: 20, 50, and 70, where:
-
ADX < 20: The market is trendless
-
20 < ADX < 50: The market is starting a new trend
-
50 < ADX < 70: The market has a relatively strong trend
-
ADX > 70: The market is in a very strong trend
In reality, it’s rare for the ADX to reach the 70 level unless there’s a strong market dump or pump.
In addition, ADX is considered a lagging indicator, meaning that investors cannot rely on its crossovers with the 20, 50, or 70 levels for timely trading signals, since price action typically moves before the indicator does. Therefore, the ADX line can only be used to determine whether a trend is strong or weak, but it should not be used as a standalone trading signal.
2.2. DI+ Line
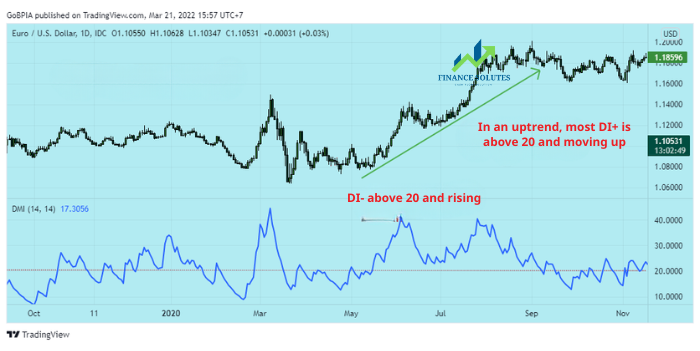
The DI+ line represents the bullish (upward) trend. If the bulls are dominant, the DI+ line will move upward. For this indicator, the 20 level is considered the most important, because an uptrend is only confirmed when DI+ is above 20 and continues to rise.
A higher DI+ value indicates a stronger uptrend. However, it’s important to note that when the DI+ line moves downward, it does not necessarily mean that the price will decline accordingly.
2.3. DI- Line
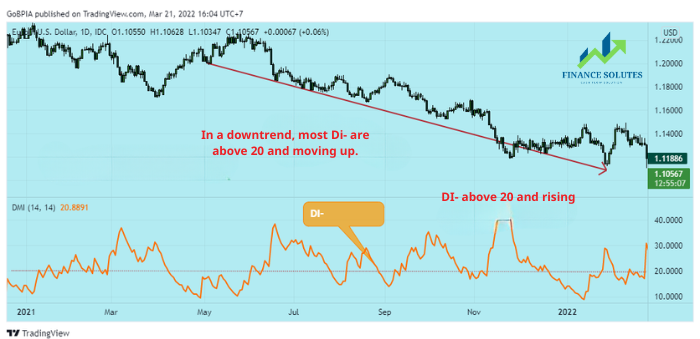
The DI- line represents a bearish (downward) trend. If the bears are dominant, the DI- line will move upward. Similar to DI+, the 20 level is very important for DI-, because a downtrend is only confirmed when DI- is above 20 and continues to rise.
Additionally, the higher the DI- value, the stronger the downtrend. However, it’s also important to note that even if the DI- line moves downward, it does not necessarily mean that the price will go back up.
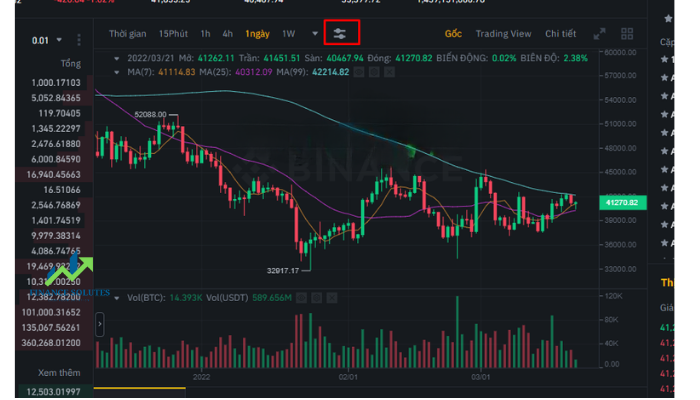
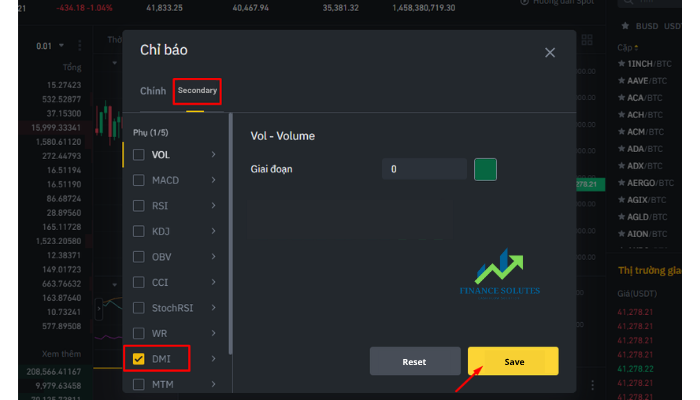
3. HOW TO SET UP THE DMI INDICATOR ON TRADINGVIEW AND BINANCE
To install the DMI indicator on any trading platform, the first thing you need to do is register an account, then log in and go to the Chart section. In this part, TradaFX will guide you through setting up the DMI indicator on the TradingView platform and the Binance cryptocurrency exchange.
3.1. Setting Up the DMI Indicator on TradingView
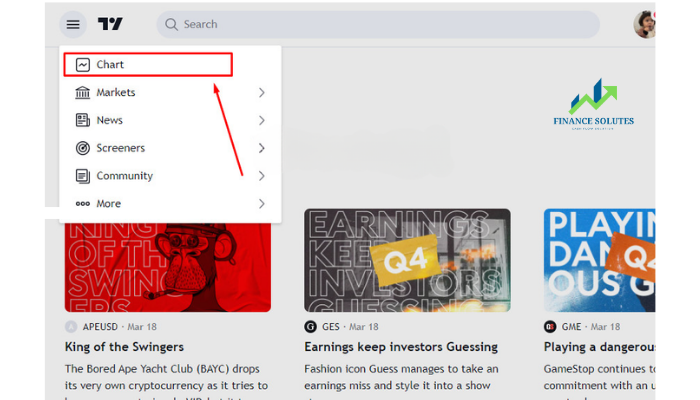
After successfully registering an account on TradingView, go to the homepage interface and click on “Chart” to open the analysis chart.
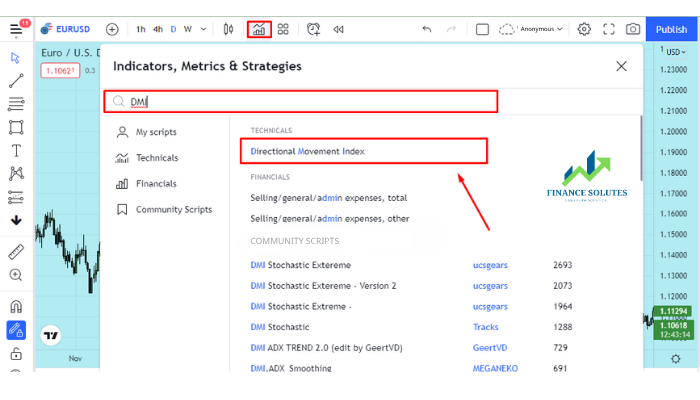
Once you’re on the chart, follow these steps in order:
-
Click on the “Fx” icon in the top toolbar
-
In the search box, type the name of the indicator: “DMI”
-
When the search results appear, click on the first result
- t.me/finance_solutes
- Website: https://finance-solutes.com
- Hotline: +1 929 5636 439 ( Hotline )
- 26 Broadway, Suite 934, New York, 10004, US
