
 XM
XM Bybit
Bybit Binance
 Robinhood
 Webull
 IC Markets
 Pepperstone
 OKX
OKX Vantage
 VT Markets
 BingX
BingX Gate.io
 Kucoin
 MEXC
MEXC Exness
 Bitget
The Dollar Index is also known by several other names such as the DXY Index or the USD Index. This is an extremely important indicator due to its significant influence on the market. So what exactly is the DXY Index or the USD Index, and why does it attract the attention of most investors? Today’s article will provide the answers from Finance Solutes to these common forex-related questions.
1. WHAT IS THE DXY INDEX?
The Dollar Index (DXY), also known as the US Index, is an index—or in other words, a tool used to measure the value of the US Dollar (USD) against a basket of six other major currencies by evaluating their exchange rates. When the US Dollar strengthens against the other currencies in the basket, the DXY Index rises; conversely, when the US Dollar weakens against the others, the DXY Index declines.
The USD Index is influenced by the supply and demand for the US Dollar as well as for the other currencies in the basket. More broadly, market supply and demand are affected by government monetary policies—particularly interest rates—and various other factors such as inflation, market sentiment, political developments, and more. Just as the stock market has key indices like the S&P 500, Nasdaq, and Dow Jones that significantly impact the market, the Dollar Index (DXY) is a closely watched indicator in the currency market by investors.
1.1. History of the USD Index
The Dollar Index was officially introduced in 1973 by the US Federal Reserve (FED) with the purpose of tracking the value of the US Dollar. However, to be precise, the monitoring of the USD’s value began earlier, in 1971, after President Nixon ended the Bretton Woods Agreement. The abandonment of the gold standard led to the floating of the USD’s value on the open market, which in turn prompted the creation of the Dollar Index (DXY).
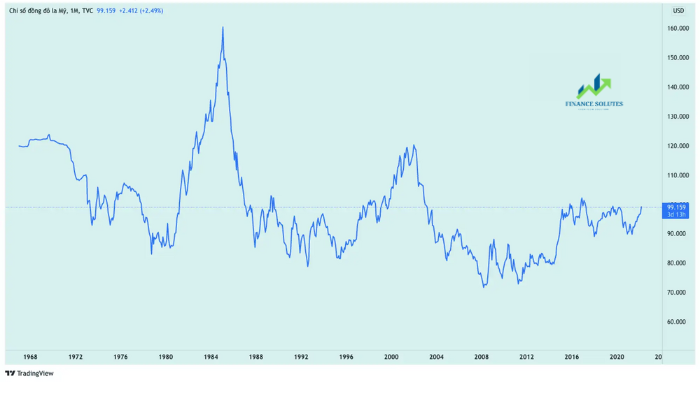
The initial value of the Dollar Index was set at 100. In 1985, ICE Futures U.S. officially took over the management of the USD Index. Therefore, at times, the DXY Index may also appear under the name “ICE US Dollar Index.” The value of the Dollar Index peaked at 164.72 in February 1985 and later fell to its all-time low of 70.698 in mid-March 2008, impacted by the fallout from the Bear Stearns bailout. By the end of 2008, a global economic crisis had unfolded, and the USD became a safe-haven asset for investors, pushing the Dollar Index back up above the 85 level.
1.2. Components of the US Dollar Index (DXY)
As previously mentioned, the DXY Index measures the USD’s value against a basket of currencies. This basket consists of six major currencies—well known to forex traders—which contribute to the index with the following weightings:
- Euro (EUR) – 57.6%
- Japanese Yen (JPY) – 13.6%
- British Pound (GBP) – 11.9%
- Canadian Dollar (CAD) – 9.1%
- Swedish Krona (SEK) – 4.2%
- Swiss Franc (CHF) – 3.6%
Looking at this composition, it’s clear that European currencies dominate the basket, with significantly larger weights than the others. These currencies are included because they represent the major trading and economic partners of the United States.
2. HOW TO READ THE DXY INDEX AND USD INDEX CHART
Similar to stock market indices, the Dollar Index also has a price chart. Traders can easily view the live DXY chart today using free online charting platforms like TradingView. Later in this section, we will also mention a variation of the Dollar Index known as the Trade-Weighted U.S. Dollar Index, which uses different weightings.
2.1. Formula for Calculating the DXY Index
The formula for calculating the DXY is relatively complex and typically used only by economists or market experts. However, traders can still refer to it to broaden their knowledge.
Below is the formula for calculating the DXY Index:
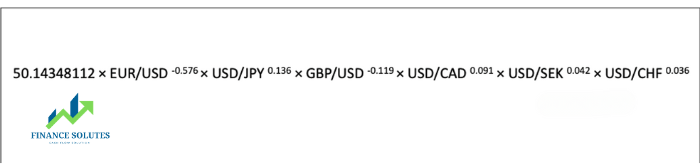
The calculation of the Dollar Index is based on the weightings of the currencies in the basket mentioned above.
2.2. How to read the Dollar Index (DXY)
To view the DXY price chart today or any other Dollar Index chart—such as the USD Index chart today—you need to go to the official TradingView website. Once there, navigate to the “Chart” section, then click on the search bar located at the top left corner of the screen. By default, the platform will typically display the EUR/USD chart when you first access it.
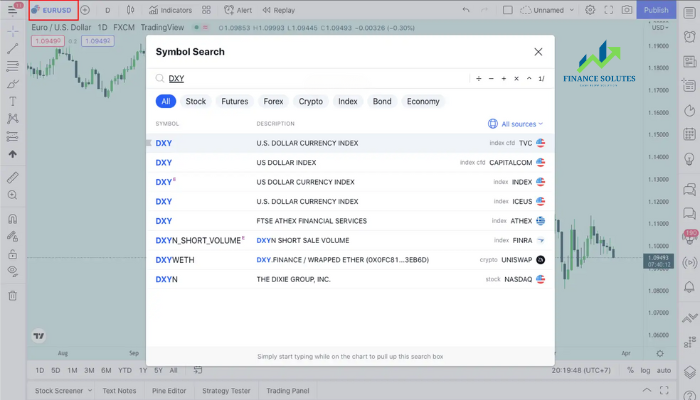
You will search for the Dollar Index chart by entering “DXY” into the search bar and selecting the DXY index, which usually appears as the first result. Traders can also add the DXY chart to their Watchlist for easier tracking.
Just like other indices, observing the price fluctuations of the Dollar Index can help determine the current trend of the U.S. dollar. Traders can fully apply analytical approaches such as technical analysis to analyze the DXY index.
The Dollar Index measures changes from the base level of 100. Therefore, there are two scenarios: one is when the DXY index rises, and the other is when the Dollar Index falls. Take a look at the example USD Index chart below to better understand this concept:
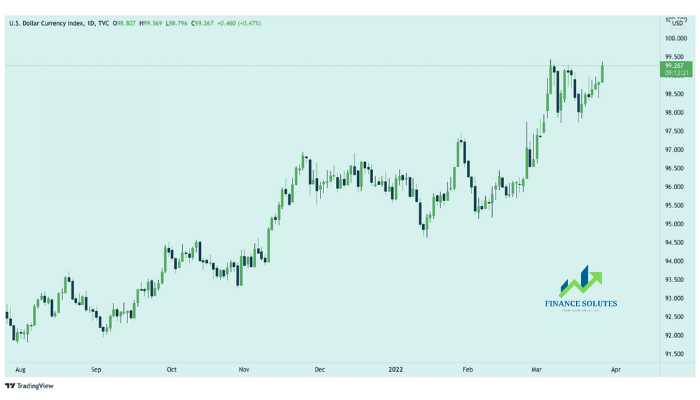
You are currently seeing that the DXY Index price today is at 99.267. This means that compared to the base level of 100, the Dollar Index has decreased by 0.733%. Conversely, for example, if the Dollar Index today is at 112, it means that compared to the initial base level, the USD Index has increased by 12%.
3. HOW DOES THE DXY INDEX AFFECT THE FOREX MARKET?
So why should forex traders pay attention to the Dollar Index?
First, the USD is the most widely used currency in the world and also serves as the primary reserve currency. Due to its high liquidity, the U.S. dollar is chosen as the preferred payment method for global transactions. The Dollar Index reflects the strength or weakness of the dollar and also acts as a pricing mechanism for many commodities.
The explanation above provides a brief overview of the importance of this index to the market. Analyzing and evaluating the U.S. Dollar Index (DXY) gives traders a comprehensive view of commodity markets, USD-based currency pairs, stocks, and other indices. Based on the assessment and prediction of the dollar’s weakening through the DXY, traders can strategize by trading higher-risk currencies or looking for pairs like USD/JPY as a safe haven.
4. TRADE-WEIGHTED U.S. DOLLAR INDEX
Because the original Dollar Index is heavily influenced by the EUR (having the highest weight), the U.S. Federal Reserve created another index called the Trade-Weighted U.S. Dollar Index, also known as the Nominal Broad-Dollar Index, in 1998.
Unlike the original Dollar Index, which compares the dollar to a basket of major currencies, the Nominal Broad-Dollar Index measures changes in the dollar’s value relative to the currencies most used in U.S. imports and exports. Instead of having EUR as the primary weighted currency, the weights are distributed based on trade with specific countries. The top 10 countries by weight are as follows:
| Country | Weight (%) |
|---|---|
| Euro Area | 19.599 |
| China | 14.763 |
| Mexico | 13.248 |
| Canada | 12.988 |
| Japan | 5.953 |
| United Kingdom | 4.966 |
| South Korea | 3.511 |
| Switzerland | 3.371 |
| India | 2.715 |
| Taiwan | 2.482 |
(*) Data sourced from the “Foreign Exchange Rates” section on the official website of the U.S. Federal Reserve (FED).
5. APPLYING THE DOLLAR INDEX IN FOREX TRADING
So how can you use the DXY Index in forex trading? The most effective way is always to trade with the trend, as the well-known saying in trading goes: “Trend is your friend.” Accordingly, traders can operate as follows:
- When the Dollar Index shows a clear uptrend, signaling the strength of the U.S. dollar, you should look for opportunities to take long positions on the USD.
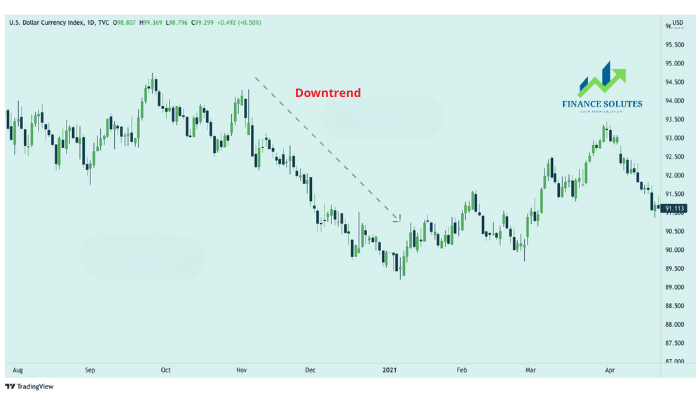
- On the other hand, when the trend in the USD Index chart shows a downward movement, indicating a weakening dollar, traders should look for opportunities to sell USD.
Thanks to the clearly identified trends, traders can find opportunities to trade correlated currency pairs. The Dollar Index chart can be used as an additional signal. This is because the majority of forex traders also monitor the DXY index, so support and resistance levels on the USD Index chart can significantly impact forex charts as well.
Correlated currency pairs are those that tend to move similarly to the Dollar Index trend, including: USD/CHF, USD/JPY, USD/CAD. However, this does not guarantee that these correlated pairs will always follow the same trend as the Dollar Index.Take-profit or stop-loss rules can be applied in the same way as in regular forex trading.
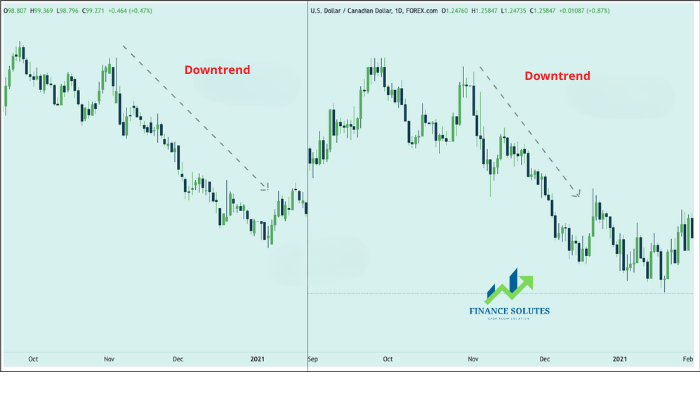
The same principle applies to negatively correlated pairs such as EUR/USD, GBP/USD, AUD/USD, NZD/USD — meaning that when the DXY rises, traders should look for selling opportunities in these pairs, and buying opportunities when the DXY falls.
6. CONCLUSION
With the knowledge provided in this article about the Dollar Index, traders not only understand concepts like what the DXY Index is, how to calculate it, and how to read the USD Index chart, but also how to apply the Dollar Index in forex trading. However, as with all trading strategies mentioned by Finance Solutes, nothing is perfect or absolute. Therefore, always remember to place stop-loss orders and be prepared with a risk management plan and a solid trading strategy.
- t.me/finance_solutes
- Website: https://finance-solutes.com
- Hotline: +1 929 5636 439 ( Hotline )
- 26 Broadway, Suite 934, New York, 10004, US
