
 XM
XM Bybit
Bybit Binance
 Robinhood
 Webull
 IC Markets
 Pepperstone
 OKX
OKX Vantage
 VT Markets
 BingX
BingX Gate.io
 Kucoin
 MEXC
MEXC Exness
 Bitget
What is Wyckoff? Besides technical analysis and fundamental analysis—two popular traditional methods in trading financial markets—there are also various other useful approaches. One of the well-known names that cannot be overlooked is Wyckoff.
To be able to apply and use the Wyckoff method in depth, traders will need not only to understand the concept of what Wyckoff is but also to grasp the Wyckoff rules, Wyckoff patterns from the most basic to advanced Wyckoff techniques. For more details, let’s explore in the article below.
1. WHAT IS WYCKOFF?
Wyckoff is the name of a method invented and developed in the early 1930s. It is a market analysis approach that studies price action movements based on examining the relationship between supply and demand. It also serves as the foundation and basis for the development of many other methods and models, such as the Wyckoff Volume Spread Analysis (VSA) method and the Spring Upthrust pattern.
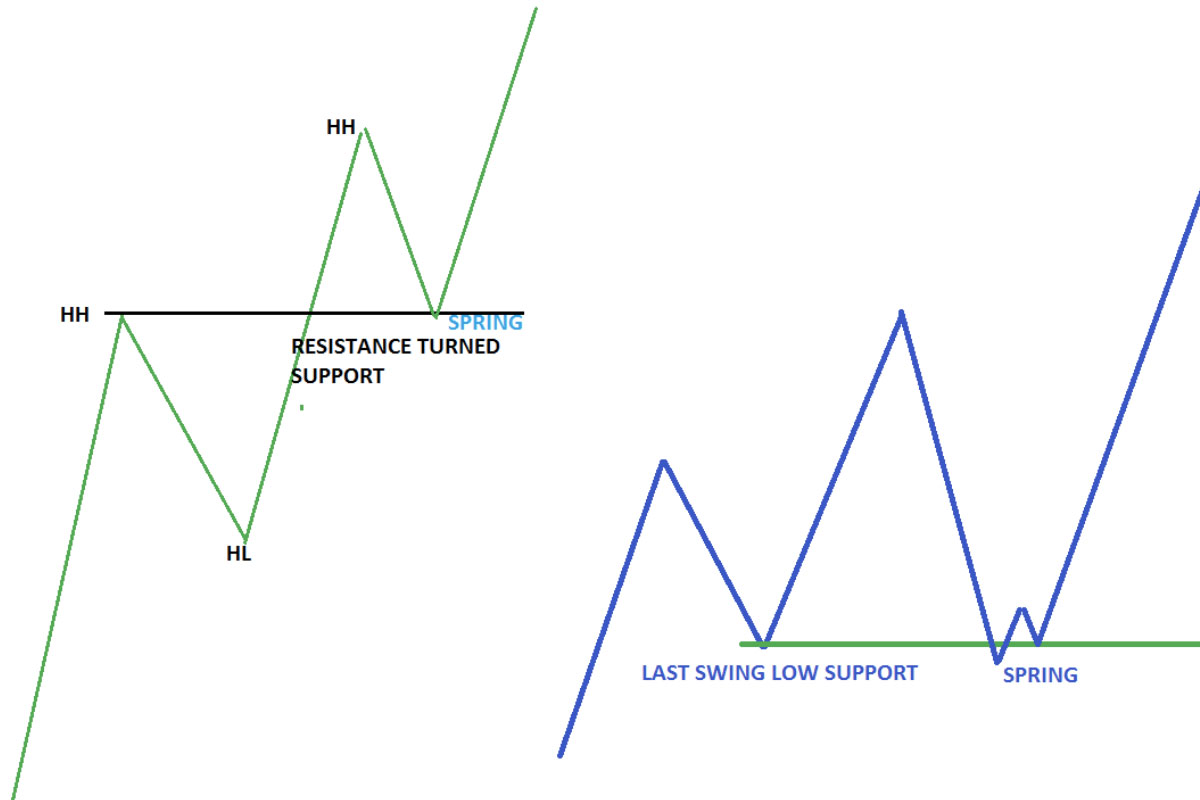
The Wyckoff method is a set of principles, rules, and trading techniques researched and designed to help traders assess the overall market and identify suitable potential trading opportunities as well as determine trading targets. Initially, the Wyckoff indicator was primarily applied in the stock market. However, over time, the modern Wyckoff method has become widely used across various financial markets such as forex, crypto, commodities, and more.
1.1. Who is Wyckoff?
Wyckoff, or Richard Wyckoff, full name Richard Demille Wyckoff, was born in 1873 and was an extremely successful investor in the American stock market from the early 1900s. He is considered one of the “icons” of technical analysis in the stock market alongside names like Elliott, Dow, Gann, and others. He began his career at a brokerage firm in New York when he was only 15 years old. By the age of 20, Richard was leading his own company.
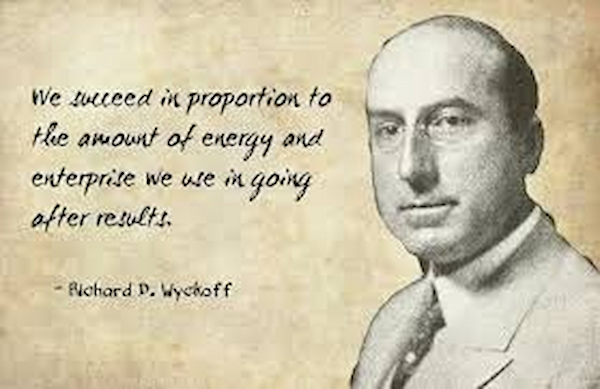
Not only that, he also founded, wrote for, and edited The Magazine of Wall Street, which at one point had over 200,000 subscribers. After achieving considerable success in his investment journey with a massive fortune, Richard Wyckoff began to share his trading method with the public, especially after uncovering deceptive tactics used by major corporations in the market. In 1930, he established a stock trading school that later became known as the “Stock Market Institute.”
1.2. History of Wyckoff Method Development
Richard Wyckoff observed the market and the trading strategies of legendary figures such as J.P. Morgan and Jesse Livermore. Based on his observations and interviews with these prominent traders, he systematized and distilled the rules, principles, and techniques of trading methods, capital management, and trading psychology.

At that time, the Wyckoff method was primarily used to identify potential trades, buy and sell opportunities, analyze market trends, and explain how to use charts in the stock market and stock trading. Over time, the modern Wyckoff method has been applied more broadly to other financial markets.
2. THE 3 LAWS IN THE WYCKOFF METHOD
The Wyckoff method is built upon three fundamental laws that influence many aspects of the analysis process, including the law of supply and demand, the cause and effect principle, and the effort versus result relationship.
2.1. Law of Supply and Demand
In reality, the law of supply and demand is a basic economic principle, not unique to the Wyckoff method. However, this fundamental law serves as the central, core principle of the Wyckoff method. Analyzing supply and demand can somewhat assist traders in analyzing price movements in the market. Specifically:
- Prices rise when demand exceeds supply
- Prices fall when demand is less than supply
- Prices remain stable when supply balances demand
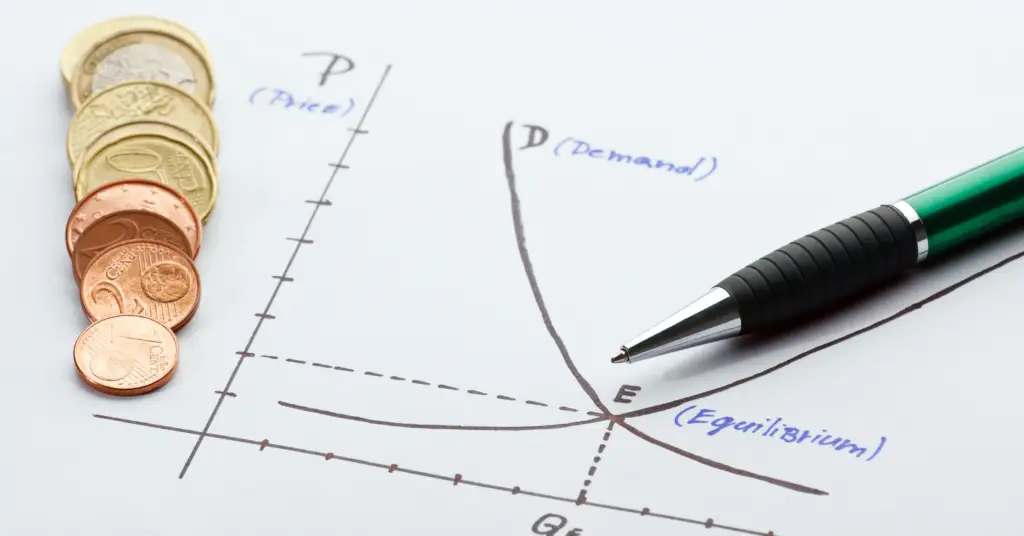
Traders can observe the relationship between supply and demand by comparing trading volume and price bars over a period of time. Although the first law of the Wyckoff method may sound simple, learning Wyckoff to accurately assess supply and demand on charts is not easy and requires a significant amount of time.
2.2. Law of Cause and Effect
Every result is preceded by one or more causes. This law helps investors analyze and set targets by calculating the potential of a new trend from a trading range. When analyzing this law in the Wyckoff method, traders primarily use Figure and Point charts.
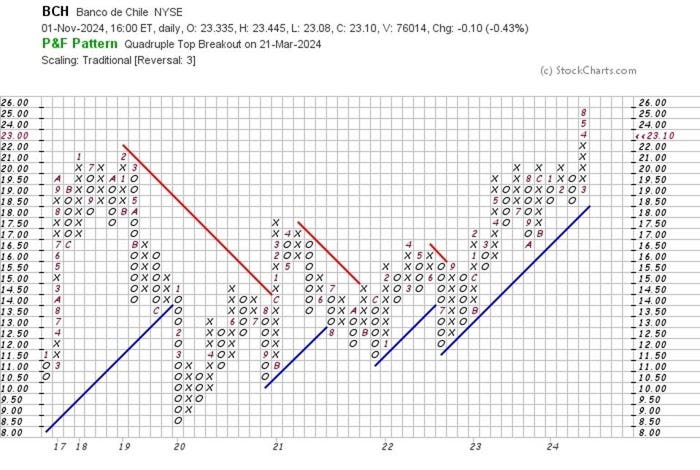
According to Richard Wyckoff, price increases are the result of a process, specifically an accumulation phase, rather than a random occurrence. Similarly, price declines are caused by the distribution phase. Essentially, this law explains the effect of price movements.
2.3. Law of Effort vs. Result
The final law in the Wyckoff method is used to determine whether a particular market trend is likely to continue. It compares trading volume (effort) with price action (result).
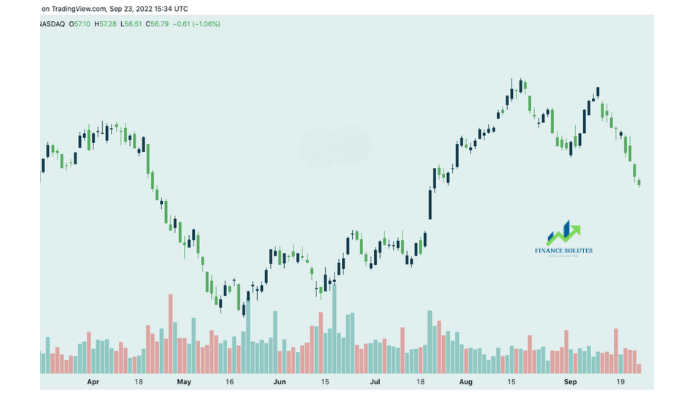
For example, when looking at the trading volume chart below the price chart, you may notice a large volume bar (indicating significant effort), but the price action remains within a narrow range after a substantial recovery and is unable to form a new high. This can give investors a signal that a trend change may be imminent.
3. WYCKOFF MODEL CYCLE
According to Richard Wyckoff, traders can understand and predict the market by analyzing supply and demand, studying price action, and trading volume. After a period of observation and research, both individual investors and groups of traders with high success rates, he described the stages that occur in a price cycle through a diagram. Using this Wyckoff diagram, investors can identify the appropriate timing to enter trades.
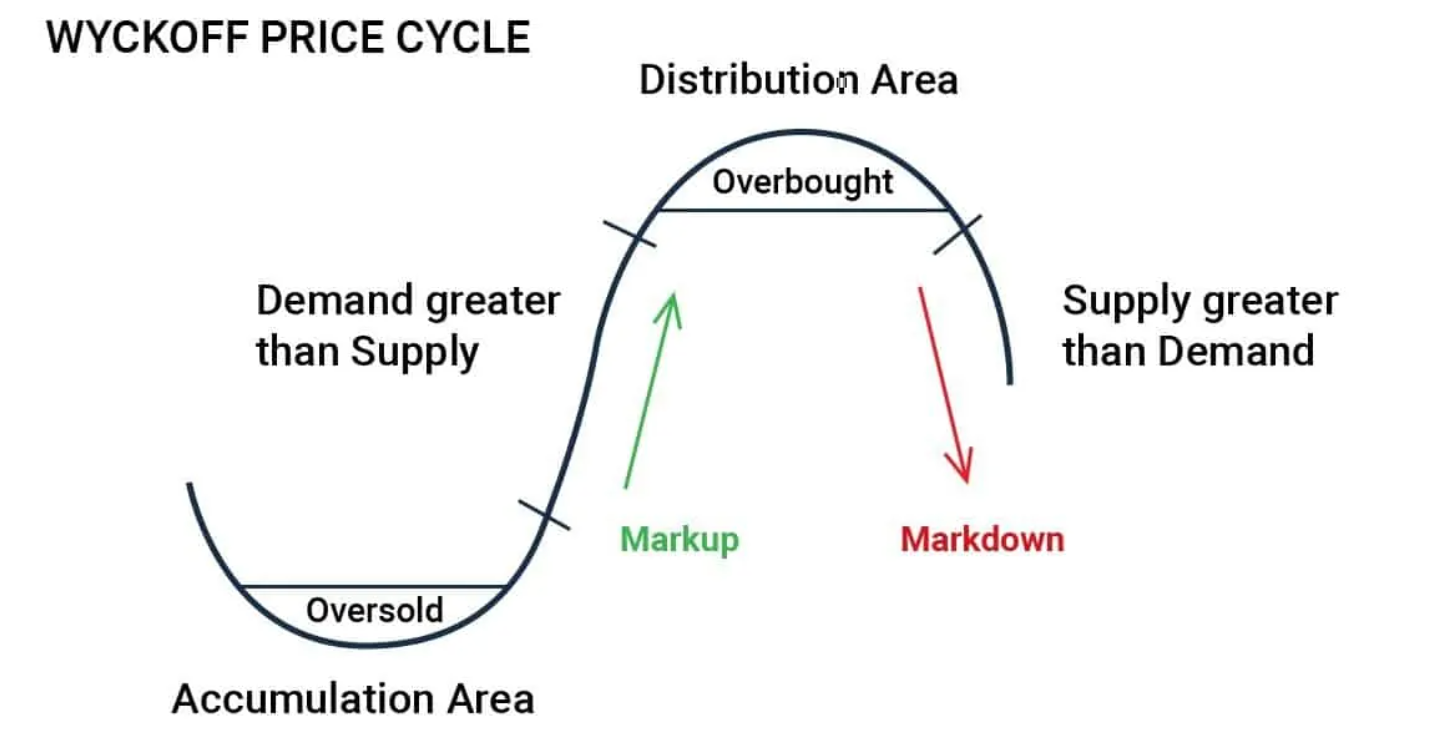
Basically, the Wyckoff Price Cycle is divided into four stages:
- Accumulation Phase – Wyckoff Accumulation: During this phase, the price moves sideways, occurring after a prolonged downtrend. At this point, large investors increase their buying positions, boosting demand in the market.
- Markup Phase: When the price breaks out of the previous accumulation phase, an uptrend is considered to have begun. After large investors hold a sufficient amount of shares and demand overpowers supply, the buyers push the price higher, forming a new uptrend.
- Distribution Phase – Wyckoff Distribution: When the uptrend starts to weaken and fails to create new highs, the market gradually enters the distribution phase. Similar to accumulation, the price moves sideways during this stage.
- Markdown Phase: The “big players” in the market start to take selling positions, pushing prices lower. Smaller traders are also encouraged to sell, causing demand to be less than supply, which drives the price down.
4. THE “COMPOSITE MAN” LAW IN WYCKOFF THEORY
The Composite Man is a concept created and studied by Wyckoff as a hypothetical version of the market. This tool helps traders gain an overall perspective to visualize the market more concretely and better understand price movements.
Simply put, the Composite Man represents the “big players” mentioned in the Wyckoff Price Cycle above, also known as market makers. Richard Wyckoff encouraged small investors to trade and invest in the market as the Composite Man would. His conclusions include the following observations:
- The Composite Man carefully plans and executes trading strategies, following through from beginning to end.
- The Composite Man attracts the public to buy the stocks they have accumulated by conducting large-volume trades.
- It is necessary to study individual charts in order to evaluate the stock’s price action and the motives of the big players controlling it.
- Wyckoff and his associates believed that when small traders understand the market behavior of the Composite Man, they can identify and detect many potential trading opportunities and profit from them.
5. FIVE STEPS TO APPROACH THE MARKET WITH ADVANCED WYCKOFF METHOD
The Wyckoff method proposes a 5-step market approach process that can greatly assist traders in their decision-making. Specifically:
- Identify the current market and potential trend: Understanding the current supply and demand of a stock helps you better predict the next price trend.
- Select stocks that align with the trend: Simply put, in a rising market, choose stocks that are strong performers within that market. The opposite applies in a downtrend.
- Choose stocks where the “cause” is equal to or greater than your minimum target: If you plan to enter long positions, select stocks in the accumulation phase, and vice versa. This step applies the use of Point and Figure charts as mentioned in Wyckoff’s laws.
- Identify the potential for the stock price to transition to a new phase: Step 4 aims to evaluate whether the price of the stock you have chosen is ready to break out of the trading range and start a new trend.
- Determine the timeframe you will participate in the market: The founder of the Wyckoff method emphasizes that you should only execute trades when they satisfy 3 out of 4 trading conditions so that they align with the overall market trend. Thanks to this, your trades will have a higher chance of success by leveraging the market’s overall strength.
6. SUMMARY
In reality, the Wyckoff method is not a simple approach. The Wyckoff pattern model is considered one of the core principles in technical analysis. Besides the overview that today’s article “What is Wyckoff” provides, you can fully explore the Wyckoff method further through Wyckoff PDF materials or Wyckoff books.
- t.me/finance_solutes
- Website: https://finance-solutes.com
- Hotline: +1 929 5636 439 ( Hotline )
- 26 Broadway, Suite 934, New York, 10004, US
