
 XM
XM Bybit
Bybit Binance
 Robinhood
 Webull
 IC Markets
 Pepperstone
 OKX
OKX Vantage
 VT Markets
 BingX
BingX Gate.io
 Kucoin
 MEXC
MEXC Exness
 Bitget
1. PIVOT POINT FOR SIDEWAYS TRADING
The way to trade with Pivot Points is to use them as regular support and resistance levels. Just like important support and resistance levels, price will test these levels multiple times.
The more times a currency pair hits a pivot point and reverses, the stronger the level is. In fact, “pivoting” means reaching a support or resistance level and then reversing direction.
If you see that the pivot level is holding, it could offer you some good trading opportunities.
- If the price is approaching the resistance level above, you can SELL the currency pair and place a stop loss just above the resistance.
- If the price is approaching the support level below, you can BUY and place a stop loss just below the support level.
Let’s look at an example to visualize this.
Read more about Pivot Point in-depth
15-minute chart of the GBP/USD pair:
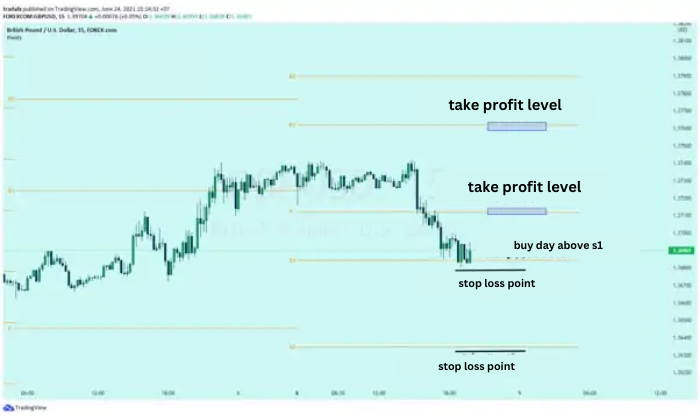
In the chart above, you can see that the price is testing the support level at S1. If you believe that it will hold, you should buy at the market price. Then, you need to place a stop loss just beyond the next support level.
If you are more cautious, you can set a wider stop loss just below S2. If the price breaks through S2, it is likely that the price will not bounce back. This is because both S1 and S2 could become resistance levels.
If you are more aggressive and confident that the support at S1 will hold, you can place your stop loss just below S1.
For the take-profit point, you could target PP or R1, as they could also provide some resistance levels. Let’s see what would have happened if you bought there.
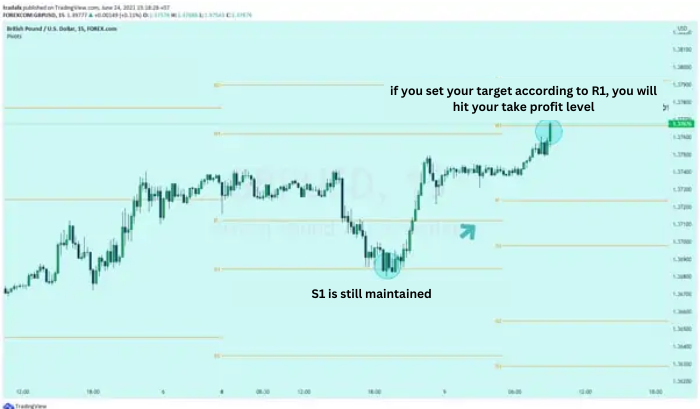
It seems like S1 held as a support level! Moreover, if you targeted R1 as your take-profit point, that’s fantastic.
Of course, it’s not always that simple. You should not rely solely on pivot points. You should pay attention to whether the pivot points align with previous support and resistance levels.
To be more certain, you should combine them with candlestick patterns and other indicators.
For example, if you see a Doji candlestick forming at S1 or Stochastic showing oversold conditions, it is highly likely that S1 will be seen as a support level.
Trades often occur between the first support and resistance levels. Occasionally, the price will test the second levels. Sometimes, the third levels will also be tested. However, you should also understand that sometimes, the price can break through all of these levels.
2. PIVOT POINT FOR BREAKOUT TRADING
Pivot points don’t last forever. Although the range trading strategy with pivot points is effective, it’s not always the case. During times when these levels fail to hold, you should be prepared with some tools in your trading toolbox to react to changing situations!
2.1. Using Pivot Points for Potential Breakout Trades
Let’s look at the chart below. You can see potential breakout trades using pivot points. Below is a 15-minute chart of the EUR/USD pair.
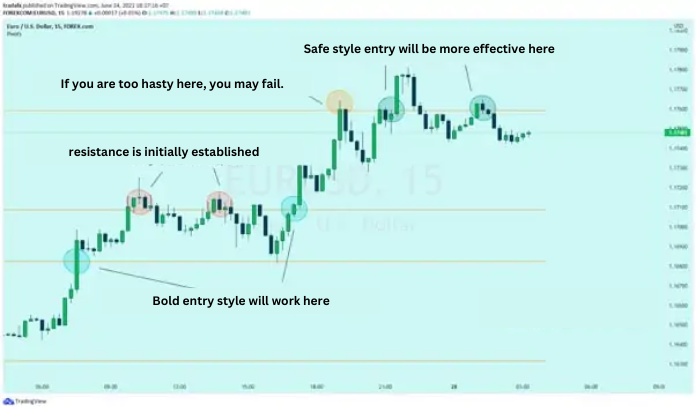
You can see that the EUR/USD pair had a strong upward movement throughout the day, with the opening price creating an upward “GAP” above the pivot point. The price rose sharply before pausing briefly at R1.
Eventually, the resistance level was broken, and the pair continued to rise by 50 pips!
If you followed the “aggressive way,” you would have caught the initial move and would likely be very pleased. On the other hand, if you took the “safer” approach and waited for a retest, you would have missed the first breakout. The price did not retest after breaking R1. In fact, the same thing happened with R2! Notice how EUR/USD buyers attempted to push the price up to R3.
However, if you followed the “aggressive way,” you might have been tricked as the price couldn’t sustain the initial breakout. If your stop-loss was too close, you would have been stopped out. Later, you would have seen the price break out again. Note that there was also a retest of the broken resistance level. Also, observe how the pair reversed later in the day, breaking through R3. That was an opportunity for a short trade when the price retested the resistance turned support.
“Role Reversal”
Remember, when a support level is broken, it often turns into a resistance level. The concept of “role reversal” applies to resistance levels as well, where a broken resistance turns into support. This presents a good opportunity to execute the “safer” method.
2.2. Where to Set Stop-Loss and Price Targets in Breakout Trades?
One of the difficulties when executing breakout trades is choosing a position to place your stop-loss. Unlike range trading – where you are looking for a break of the pivot point support and resistance levels – here you are looking for rapid and strong price movements.
In theory, when a level breaks, it is likely to become a “support turned resistance” or “resistance turned support.” Again, this is called the role reversal. If you are entering a buy trade and the price breaks R1, you could set your stop-loss just below R1.
Let’s go back to the EUR/USD chart to see where you could place your stop.
As for setting price targets, you would typically aim for the next pivot point support or resistance level as your take-profit target. It is rare for the price to break all the pivot point levels unless a major economic event or unexpected news causes it.
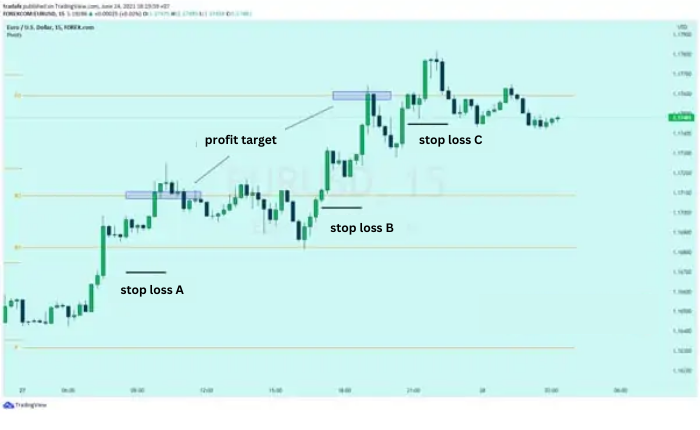
In this example, when you see the price break R1, you would place your stop-loss just below R1. If you believe the price will continue to rise, you can hold your position and manually move your stop-loss to see if the move persists. However, just like with any strategy or indicator, you must understand the risks involved when trading breakouts.
- Firstly, you don’t know whether the movement will continue. You may think that the price will keep rising, but instead, you catch the peak or the bottom, which means you’ve been “tricked”!
- Secondly, you cannot be sure whether this is a real breakout or just sudden moves caused by significant news events. A spike in volatility often occurs during news events, so be sure to stay updated with the latest news and keep an eye on the economic calendar for the day or week.
- Lastly, just like in range trading with Pivot Points, it’s best to also pay attention to other important support and resistance levels. The price may break R1, test the resistance level, and then pull back.
You should use your forex knowledge of support and resistance, candlestick patterns, and momentum indicators to provide stronger signals on whether the breakout is genuine.
3. PIVOT POINT FOR SWING TRADING
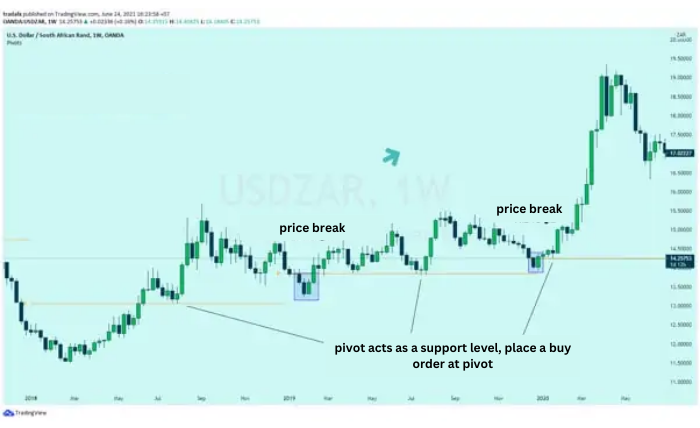
For traders who prefer medium- to long-term trading, you can apply Pivot Points to Swing Trading using weekly or monthly timeframes. The chart below illustrates a weekly chart with only the Pivot Point levels (you can adjust the settings by changing the parameters on your trading platform). It’s clear that there was a trend reversal to the upside after the price broke the previous resistance level.
Now, that resistance level has acted as support, and forex traders can set long-term buy orders at the Pivot Point level. There was a false breakout (at the blue circle), but afterward, a significant rise occurred that can be exploited. Pivot Points may not always contain crucial price zones, but they offer a level that can sustain the main market trend. This could be a lengthy period to prepare your trading plan for a Swing Trader.
Here is a weekly chart of USD/ZAR:
4. USING STANDARD PIVOT POINTS AS DYNAMIC SUPPORT/RESISTANCE
Traders can use standard Pivot Points as dynamic support or resistance levels. To visualize this more easily, you can refer to the image below:
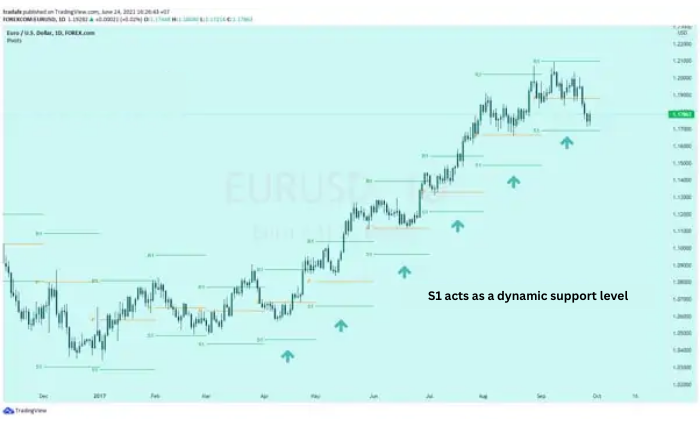
When the price and the S1 level rise, traders can move their stop loss points to align with this level. Then, they may take profits if the market reverses. S1 levels are commonly used to adjust stop loss points in a favorable direction. S2 and S3 can also be used but typically under more volatile market conditions. In such cases, it’s recommended to trade with a smaller position size than usual.
5. USING PIVOT POINTS TO MEASURE MARKET SENTIMENT
You can use pivot points to assess market sentiment. This means you can determine whether buyers or sellers are in control, or which currency pairs traders are more likely to buy or sell. When the price breaks above the PP and rises further, it signals that traders are becoming bullish on the currency pair, and you should consider buying the pair.
Below is an example of what happened when the price held above the pivot point.
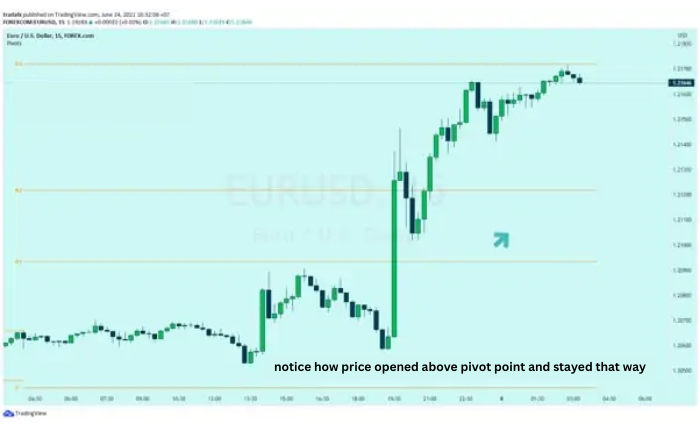
In this example, we can see that the EUR/USD pair opened above the pivot point.
Then, the price continued to rise, breaking through all resistance levels. Now, if the price breaks below the pivot point, you should consider selling.
When the price is below the pivot point, it signals a bearish market sentiment, indicating that sellers may be in control during the trading session.
Let’s take a look at the GBP/USD chart.
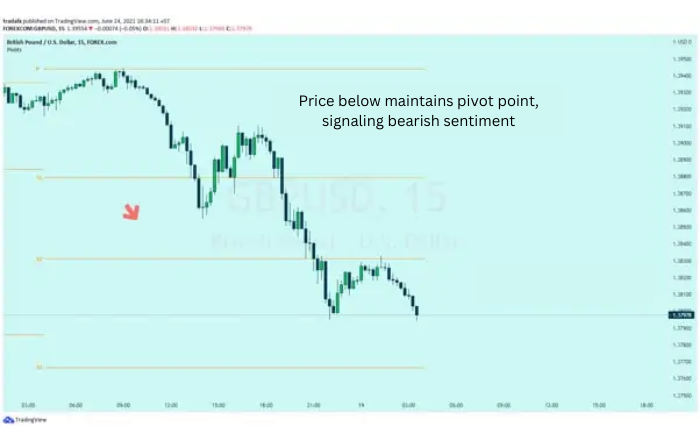
In the chart above, we can see that the price tested the pivot point, which acted as a resistance level. Then, the currency pair continued to move lower. If you had sensed that the price remained below the pivot point and decided to sell the pair, you would have made a decent profit. The GBP/USD pair dropped nearly 300 pips! Of course, it’s not always this straightforward. Sometimes, you might think forex traders are selling a currency pair, only to see the pair reverse direction and move to a new high!
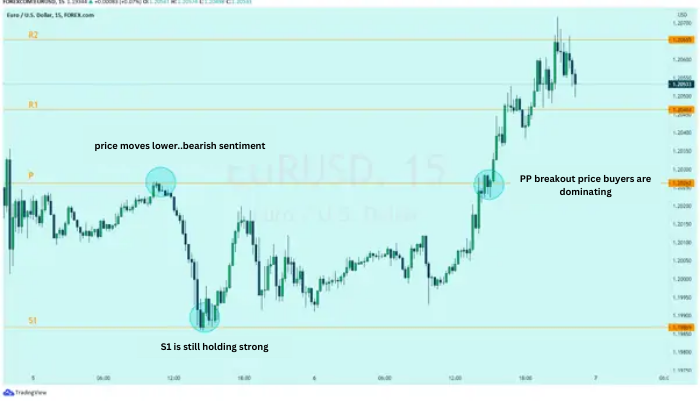
In this example, if you saw the price breaking lower from the pivot point and decided to sell, it could have been a tough day for you!
So, what’s the lesson here?
Traders are always changing! A trader’s perception of a currency can change from day to day or even from one session to another. Therefore, you can’t simply buy when the price is above the pivot point or sell when it’s below it.
6. SUMMARY
In the article on how to trade with Pivot Points, even though Pivot Points are effective, you should not rely solely on them to make trading decisions. It’s important to combine them with other indicators to help you make the best forex trades. Good luck!
- t.me/finance_solutes
- Website: https://finance-solutes.com
- Hotline: +1 929 5636 439 ( Hotline )
- 26 Broadway, Suite 934, New York, 10004, US
