
 XM
XM Bybit
Bybit Binance
 Robinhood
 Webull
 IC Markets
 Pepperstone
 OKX
OKX Vantage
 VT Markets
 BingX
BingX Gate.io
 Kucoin
 MEXC
MEXC Exness
 Bitget
Elliott waves are a form of technical analysis that looks for recurring long-term price patterns related to changes in investor sentiment. The theory identifies impulse waves that establish a pattern and corrective waves that counteract the larger trend. Continuing the forex knowledge series, let’s join Finance Solutes to learn from concepts to the most basic rules that traders need to know about Elliott waves!
1. WHAT IS THE ELLIOTT WAVE?
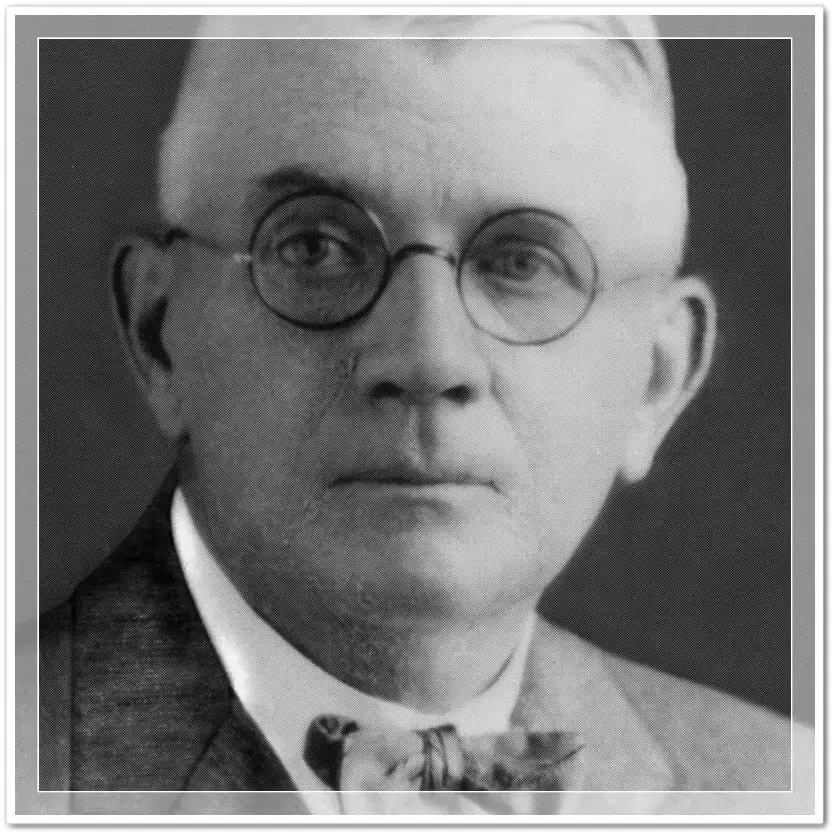
The Elliott Wave Theory was developed by Ralph Nelson Elliott in the 1930s. He studied stock market data for many years across various indices and was the first to predict the stock market bottom in 1935. Since then, this theory has become a reliable tool for portfolio managers worldwide.
The Elliott Wave Theory is based on the classic Dow Theory, which describes price movements and explains recurring price patterns in financial markets. It focuses on wave patterns in the market. The Elliott Wave Theory uses wave counts and other technical analysis components related to momentum to describe trends.
2. INTERPRETATION OF THE ELLIOTT WAVE THEORY
2.1. Elliott Wave Theory
The Elliott Wave Theory suggests that market prices constantly move up and down in a wave pattern formed by trader psychology. The market does not record political, economic, and social events themselves but rather traders’ reactions to these events.
Elliott wave patterns are believed to be repetitive, allowing traders to make predictions based on past data. However, each trader may have a different interpretation of the Elliott Wave structure of the market at a given time.
2.2. Mechanism of Action
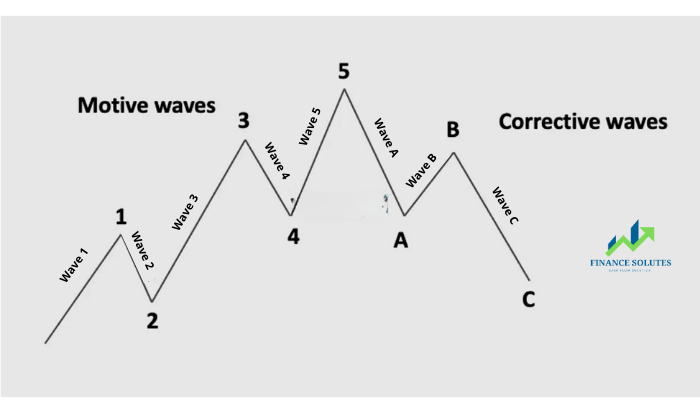
In his theory, Elliott identified two different wave phases: motive waves (also known as impulse waves) and corrective waves. By observing these waves, investors can gain deeper insights into ongoing trend dynamics and analyze price movements more effectively.
For example, Impulse Waves include both upward and downward trends, consisting of five sub-waves, which can last for hours or even years.
3. ELLIOTT WAVE PATTERN (MOTIVE AND CORRECTIVE WAVES)
In the Elliott Wave pattern, market prices alternate between motive waves and corrective waves, with no time limit for each wave phase.
Motive waves, also known as impulse waves, are broken down into a set of five smaller-degree or shorter waves. These are interspersed with corrective waves. As a result, Wave 1, Wave 3, and Wave 5 in Elliott Wave Theory are impulse waves, while Wave 2 and Wave 4 are corrective waves, acting as minor pullbacks (short waves) within Wave 1 and Wave 3.
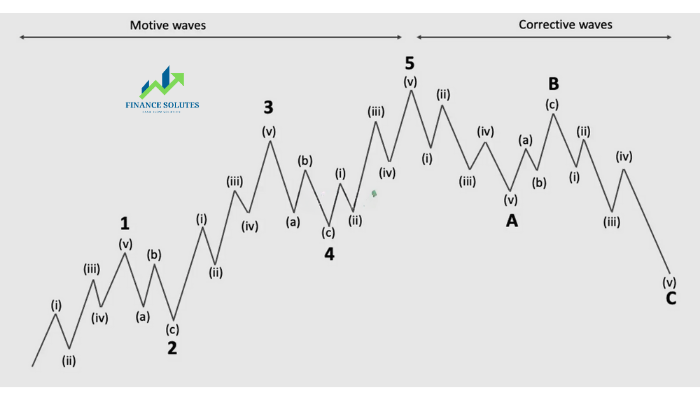
In the illustration above, Wave 1, Wave 3, and Wave 5 in the Elliott Wave Theory are further divided into five smaller-degree impulse waves, labeled as (i), (ii), (iii), (iv), and (v). Meanwhile, Wave 2 and Wave 4, which are corrective waves, are subdivided into three smaller waves, denoted as (a), (b), and (c). This structure is also known as the wave within a wave pattern, meaning that larger waves are broken down into smaller ones.
3.1. Characteristics of Elliott Waves
Wave 1 – In Elliott Wave Theory, Wave 1 is often not very clear when it first appears.
Wave 2 emerges as a corrective phase for Wave 1. However, Wave 2 must never retrace beyond the peak of Wave 1. The trading volume of Wave 2 is lower than that of Wave 1, so its retracement usually does not exceed the Fibonacci 61.8% level.
Wave 3 is typically the largest wave in the Elliott Wave pattern (although, according to some studies, Wave 5 is the largest in commodity markets). At the end of Wave 4, more buying pressure emerges, and prices begin to rise again.
Wave 4 is usually a clear corrective phase. Prices may move sideways for an extended period, and Wave 4 often retraces less than 38.2% of Wave 3.
Wave 5 is considered the final wave in the market’s primary trend. The price increase in Wave 5 is driven by a smaller group of traders.
Corrective waves (a, b, c) are often more difficult to identify than motive waves. Most analysts view Wave A as a correction within an ongoing bull market.
Wave B forms as a short-term upward reversal. Wave C follows and is typically at least as long as Wave A, often extending 1.618 times the length of Wave A or more.
3.2. Advanced Elliott Wave Principles
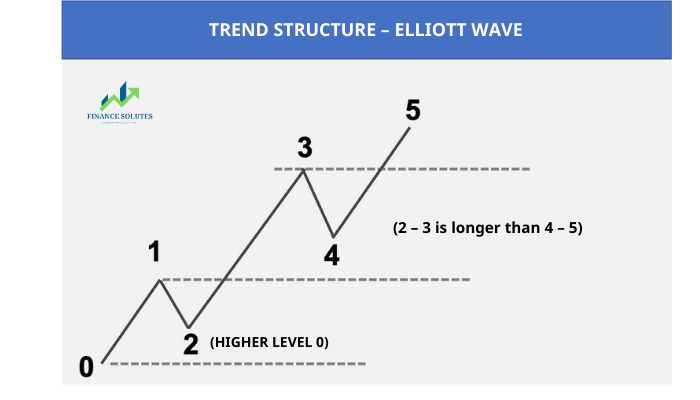
There are 3 rules that must be followed in Advanced Elliott Wave:
– Wave 2 (first correction wave) cannot retrace below the origin point of wave 1.
– The second correction cannot be lower than the first high. That means score 4 cannot be lower than score 1.
– The second Motive Wave is usually longer than the last motive wave. That is, the distance between 2 – 3 is longer than between 4 – 5.
There are additional Elliott Wave principles that are not strictly enforced and can sometimes be broken. These include:
- Wave 2 and Wave 4 can occasionally exceed the Fibonacci retracement levels.
- Wave 5 may not always surpass the end of Wave 3.
Once you grasp the basics of Elliott Waves, you’ll understand why this method is so popular in trading. However, rigidly following every rule can lead to challenges when applying the theory in real market conditions.
After completing a five-wave Elliott pattern, traders should observe whether price action breaks the trend structure of Dow Theory. If the price fails to create higher highs and starts forming lower lows, this may indicate a potential trend reversal.
Additionally, traders should not be too rigid in counting Elliott Waves. Just because a five-wave Elliott pattern appears complete, it does not necessarily mean the trend has ended.
3.3. How to Identify Elliott Waves
To recognize Elliott Waves, follow these four key rules:
- Rule 1: Wave 2 must never retrace more than 100% into Wave 1’s territory.
- Rule 2: Wave 3 is typically the longest wave.
- Rule 3: Wave 3 must surpass the height of Wave 1.
- Rule 4: Wave 4 should not retrace more than 100% beyond the end of Wave 1.
4. LEVELS AND TYPES OF WAVES IN ELLIOTT WAVES
Elliott Waves are categorized into different degrees, which help analysts determine the wave’s position in the overall market cycle. Elliott identified nine wave degrees, ranging from Grand Super Cycle (lasting decades or even centuries) to Subminuette, which can occur within minutes.
| Wave Degree | Motive Waves | Corrective Waves | Timeframe |
|---|---|---|---|
| Grand Super Cycle | [I], [II], [III], [IV], [V] | [[a]], [[b]], [[c]], [[w]], [[x]], [[y]] | Months |
| Super Cycle | (I), (II), (III), (IV), (V) | (a), (b), (c), (w), (x), (y) | Weeks |
| Cycle | I, II, III, IV, V | a, b, c, w, x, y | Days |
| Primary | [1], [2], [3], [4], [5] | [A], [B], [C], [W], [X], [Y] | 4 hours |
| Intermediate | (1), (2), (3), (4), (5) | (A), (B), (C), (W), (X), (Y) | 1 hour |
| Minor | 1, 2, 3, 4, 5 | A, B, C, W, X, Y | 30 minutes |
| Minute | [i], [ii], [iii], [iv], [v] | [a], [b], [c], [w], [x], [y] | 15 minutes |
| Minuette | (i), (ii), (iii), (iv), (v) | (a), (b), (c), (w), (x), (y) | 5 minutes |
| Subminuette | i, ii, iii, iv, v | a, b, c, w, x, y | 1 minute |
Table of Elliott wave levels
The Grand Super Cycle, Super Cycle, and Cycle wave levels can last for centuries, decades, and years, respectively. The lower wave levels have progressively shorter durations, with the Subminute wave level typically measured in minutes.
5. THE RELATIONSHIP BETWEEN FIBONACCI AND ELLIOTT WAVES
In Elliott Waves and Fibonacci, Fibonacci ratios can be useful for measuring price movement targets within the Elliott Wave structure. The different waves within the Elliott Wave structure are interconnected through Fibonacci ratios. For example, in motive waves:
- Wave 2 often corresponds to Fibonacci retracement levels of 50%, 61.8%, 76.4%, or 85.4% of Wave 1.
- Wave 3 is commonly 161.8% of Wave 1.
- Wave 4 typically retraces 14.6%, 23.6%, or 38.2% of Wave 3.
- Wave 5 is often an inverse ratio of 1.236 – 1.618% of Wave 4, equal to Wave 1, or 61.8% of Wave 1 + 3.
Traders can use this information to determine entry points and profit targets when trading.
6. TOP 3 MUST-READ BOOKS ON ELLIOTT WAVE THEORY
6.1. Elliott Wave Principle
Elliott Wave Principle by Frost & Prechter is the best-selling Elliott Wave theory book on Wall Street. It serves as a comprehensive and practical guide to Elliott Wave theory.
This book is considered a classic among investors who use Elliott Waves. Critics have praised it as “the clearest textbook on Elliott Waves.”

First published in 1978, this book is designed to help both newcomers to Elliott Waves and seasoned traders.
This book will provide you with a clear understanding of the rules of Elliott Wave theory and guide you on how to apply it to the market.
Millions of investors worldwide regard Elliott Wave Principle as a roadmap to understanding how the market operates.
More than 40 years since its first publication, the book has been translated into seven languages and continues to sell thousands of copies each year. That alone speaks volumes about its value, doesn’t it?
Currently, the book is priced at over $60 on Amazon. However, you can download the Elliott Wave Principle PDF ebook for free HERE.
6.2. Visual Guide to Elliott Wave Trading
The second book that Finance Solutes wants to introduce is Visual Guide to Elliott Wave Trading.
This book is considered an in-depth guide that provides a detailed, easy-to-use approach to trading financial markets using Elliott Wave Theory.
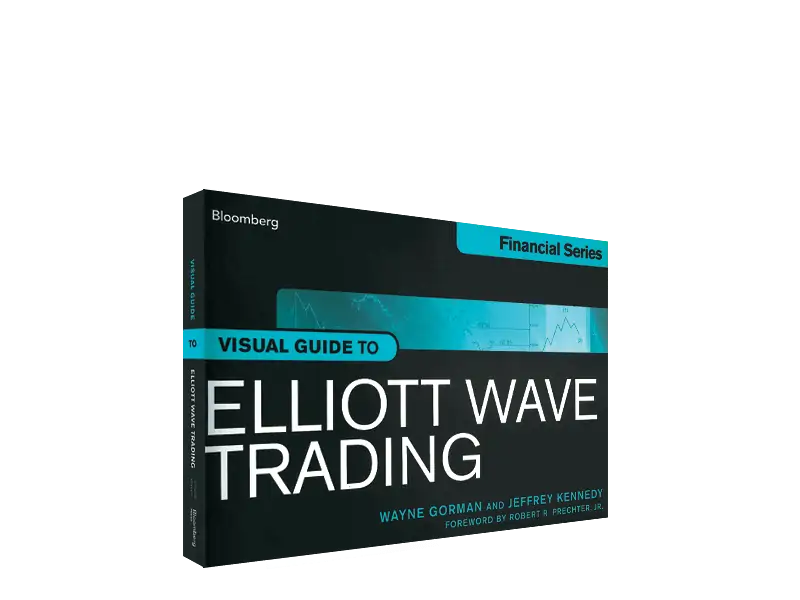
This book builds upon the knowledge from Elliott Wave Principle, making it one of the must-read classics on Elliott Wave Theory.
Visual Guide to Elliott Wave Trading is written by Wayne Gorman and Jeffrey Kennedy, two of the most trusted analysts at Elliott Wave International.
When reading this book, you’ll find it to be a perfect blend of a textbook and real-world application examples.
You can download the Visual Guide to Elliott Wave Trading PDF for free HERE.
6.3. Harmonic Elliott Wave: The Case for Modification of R. N. Elliott’s Impulsive Wave Structure
A simple Google search for “Elliott Wave books” will return over 20,000 results on related books.
After the two books above that provide you with a deeper understanding of Elliott Waves, TradaFX wants to introduce you to a different perspective on Elliott Wave theory.
That book is Harmonic Elliott Wave: The Case for Modification of R. N. Elliott’s Impulsive Wave Structure by Ian Copsey.
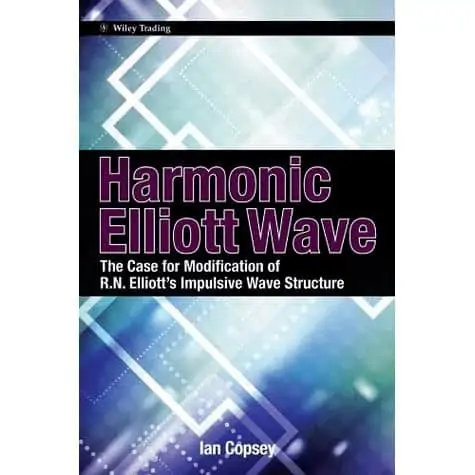
Ian Copsey identified several fundamental flaws in how Elliott Wave Theory defines the structural development of price behavior. This book provides numerous real-world examples to explain his findings.
The author aims to show readers how waves truly develop and to dispel common misconceptions about Elliott Waves that traders have misunderstood for years.
What are those misconceptions, and what modifications does the author propose? You can download the Harmonic Elliott Wave PDF for free HERE to find out.
7. CONCLUSION
Elliott Wave Theory is a great starting point and foundation for your technical analysis. However, when applying advanced Elliott Wave principles to Forex chart analysis, traders need to remain flexible rather than being overly rigid.
Each trader may interpret Elliott Wave patterns differently at any given time. Therefore, one should not impose their perspective on others or strictly follow someone else’s viewpoint when analyzing Elliott Waves.
Finance Solutes will continue this topic with more in-depth articles on motive waves, corrective waves, and Elliott Wave trading strategies—stay tuned!
- t.me/finance_solutes
- Website: https://finance-solutes.com
- Hotline: +1 929 5636 439 ( Hotline )
- 26 Broadway, Suite 934, New York, 10004, US
