
 XM
XM Bybit
Bybit Binance
 Robinhood
 Webull
 IC Markets
 Pepperstone
 OKX
OKX Vantage
 VT Markets
 BingX
BingX Gate.io
 Kucoin
 MEXC
MEXC Exness
 Bitget
Fibonacci Confluence is a method that utilizes a group of Fibonacci tools, including Fibonacci retracement and Fibonacci extension levels that occur close to each other on a price chart. Additionally, traders can fully integrate price factors into their analysis.
As previously examined, Fibonacci retracement levels can help traders identify potential support and resistance zones. Finance Solutes has previously discussed how a trader can use Fibonacci retracement levels on a long-term chart. By focusing on significant price movements, traders can find areas where support and resistance levels cluster. This provides multiple reasons for buyers and sellers to defend these key points on the chart, leading to potential trading opportunities through reversals or retracements.
Fibonacci tools have always carried a sense of mystery in technical analysis, making the discussion around them even more intriguing. Regarding their applicability in markets, the simplest version is that Fibonacci retracement levels offer potential zones for support and resistance levels to continue developing.
Today’s article will help traders better understand and apply Fibonacci confluence in forex trading.
1. ORIGIN OF FIBONACCI
The Fibonacci sequence is named after the Italian mathematician Leonardo Fibonacci. He introduced the Fibonacci sequence to the Western world through his book Liber Abaci. However, the origins of the Fibonacci sequence can be traced back to 200 BCE in Indian mathematics.
The sequence follows a simple rule: each number is the sum of the two preceding numbers. The Fibonacci sequence is as follows:
0, 1, 1, 2, 3, 5, 8, 13, 21, 34, 55, 89, 144, 233, 377, 610, 987, 1597, 2584, 4181, 6765, 10946, …
Things become more intriguing when examining the relationships between these numbers. If we take a number and divide it by its previous value, we get an approximation of 161.8%. Thus, each number in the sequence is approximately 161.8% larger than the one before it, except for the early part of the sequence (after 89). The number 1.618 or 161.8% is known as the golden ratio.
For example:
17711 / 10946 = 1.61803
10946 / 6765 = 1.61803
6765 / 4181 = 1.61803
…..
The golden ratio in Fibonacci tools is not only applied in trading but also extensively in everyday life. You may have heard of the golden ratio in facial proportions or photography, right?
In forex trading, the Fibonacci sequence has led to many extended concepts, such as Fibonacci Retracements, Fibonacci Extensions, and Fibonacci Fan.
2. WHAT IS CONFLUENCE?
In forex, confluence is a term describing how traders combine various technical analysis tools and factors to assess whether a trade has a higher or lower probability of success. Essentially, this approach reduces reliance on a single tool.
Fibonacci confluence is a method that utilizes a group of Fibonacci tools, including Fibonacci retracement and Fibonacci extension levels, that appear close to each other on a price chart.
We will draw Fibonacci by dragging the tool from the highest high to the lowest low if in a downtrend. Conversely, draw Fibonacci in an uptrend by dragging from the lowest low to the highest high.
3. APPLICATION OF FIBONACCI IN THE MARKET
While Fibonacci’s application in nature may not excite mathematics students, its use in trading is incredibly fascinating for traders. Fibonacci is widely used in financial markets, particularly in identifying support and resistance levels based on the golden ratio.
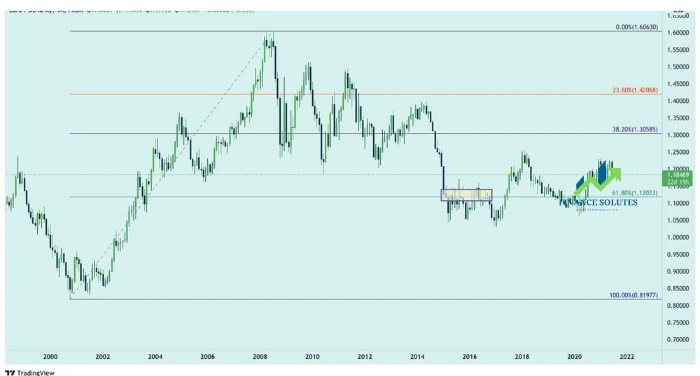
The first step is to identify a time frame where price movements are significant. Apply Fibonacci within this selected timeframe and focus on the 61.8% and 38.2% retracement levels. These levels provide key areas to monitor for potential retracements and support/resistance levels.
For example, in the EUR/USD chart below, observe the price movement from the 2000 low to the 2009 high. By marking the retracement levels from the peak, the 1.3056 level is identified as a retracement point. Additionally, the 61.8% retracement level for this movement is around 1.1212.
In 2017, the EUR/USD price declined due to the impact of the U.S. presidential election earlier that year. However, the currency pair experienced a strong reversal as buyers continued to apply pressure.
During the price reversal from the previous decline to an uptrend, the 38.2% Fibonacci retracement level of the post-election movement acted as a support level (green zone). Later, the 61.8% Fibonacci retracement level served as a resistance level (purple zone). Once the price broke above these highs and continued its upward momentum, resistance started to emerge at the 161.8% Fibonacci extension level (yellow zone).
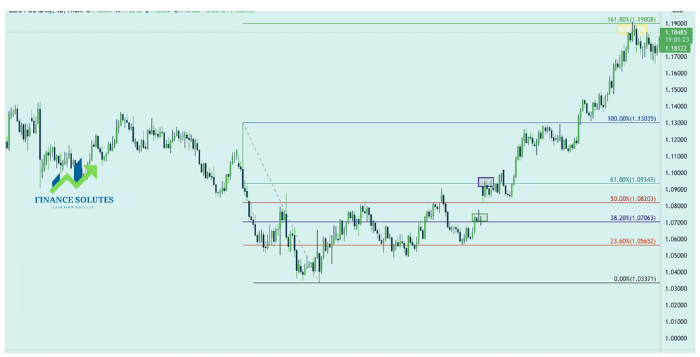
The EUR/USD chart above provided extended resistance at the 161.8% level.
3.1. In-Depth Analysis
It is evident that the 61.8% and 38.2% Fibonacci retracement levels are crucial for traders. These levels can be observed in major price movements on the chart and are applicable to both short-term and long-term charts. Generally, in technical analysis, long-term studies tend to be slightly more consistent than short-term ones.
Pay attention to this: If you divide a number in the Fibonacci sequence by the number two places ahead, the result will always be close to 0.382. For example: 13/34 = 0.382 or 34/89 = 0.382
Additionally, if you divide a Fibonacci number by the number three places ahead, the result will be approximately 0.236.
For example: 13/55 = 0.2363 or 55/233 = 0.2361
From this, we introduce another key retracement level—23.6%—as a significant point of interest. Now, traders have the 23.6%, 38.2%, and 61.8% retracement levels to identify support and resistance zones.
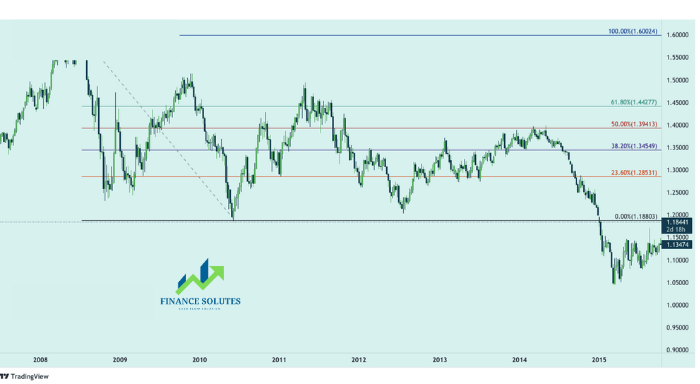
In practice, many traders will apply the midline at 50%. You may be wondering what this has to do with the Fibonacci sequence. It has nothing to do with Fibonacci, but look at the image below; you will understand why the 50% level is incorporated into the Fibonacci tool.
3.2. Fibonacci Confluence
First and foremost, remember this: The purpose of combining and analyzing these levels is not to predict with certainty what will happen in the future. No form of analysis—whether based on Fibonacci confluence, astrology, or market psychology—can guarantee future price movements. The real value of identifying support and resistance levels lies in risk management through structured trade setups.
If the price is trending higher, traders should look to buy at support levels. This is because if the uptrend fails, you can exit with minimal loss. The key is to limit potential downside in case the market reverses. However, if the uptrend continues, you are in a strong position to manage a profitable trade.
Now, let’s analyze the daily chart of AUD/USD below:
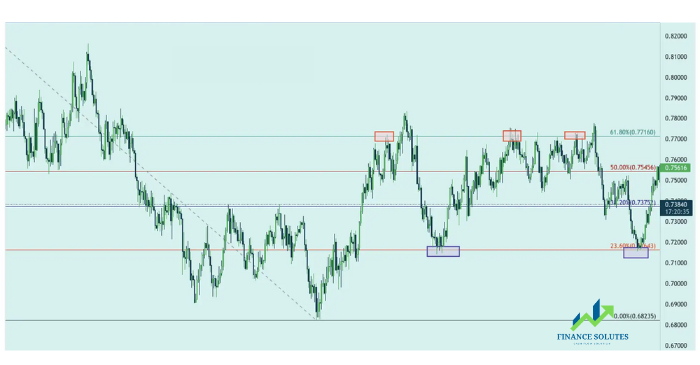
The Fibonacci retracement levels were applied to a previous bearish move—from the 2015 high down to the 2016 low. The chart also highlights key resistance and support levels at Fibonacci retracement levels.
It’s important to note that the chart isn’t perfect—it doesn’t capture every support or resistance level. However, it does help identify many useful zones. Fibonacci confluence can be combined with different analytical approaches to strengthen market analysis.
Below is an example of the AUD/USD chart. This time, we use the same Fibonacci retracement levels but add key price levels: 0.080016, 0.77552, and 0.75006.
While you might not capture every single high or low, this simple approach allows you to identify many critical levels. The resistance level held firmly around the 61.8% Fibonacci retracement. This level also aligned with the psychological price of 0.77552, which could explain why bullish momentum struggled to break through.
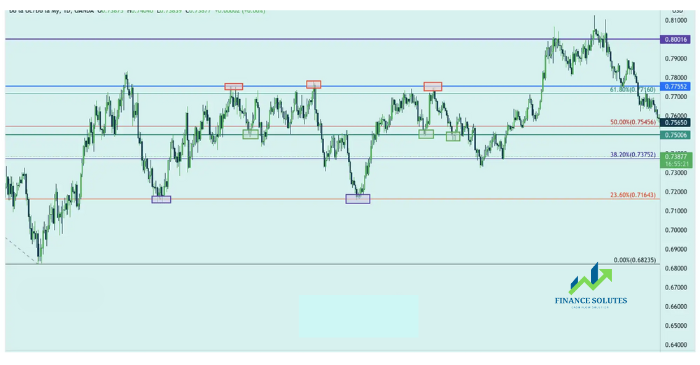
With this system of support and resistance levels in traders’ analysis, price action can be used to determine how to trade at each potential support/resistance level based on the market conditions at a given time.
4. SUMMARY
Utilizing the confluence of various factors along with Fibonacci tools can increase your trading success rate. However, as mentioned above, there is no single best forex trading method, and Fibonacci confluence is no exception. When trading, never forget to set a stop-loss and implement a proper risk management strategy.
Thank you for reading this article, and I wish you a successful trading day!
- t.me/finance_solutes
- Website: https://finance-solutes.com
- Hotline: +1 929 5636 439 ( Hotline )
- 26 Broadway, Suite 934, New York, 10004, US
