
 XM
XM Bybit
Bybit Binance
 Robinhood
 Webull
 IC Markets
 Pepperstone
 OKX
OKX Vantage
 VT Markets
 BingX
BingX Gate.io
 Kucoin
 MEXC
MEXC Exness
 Bitget
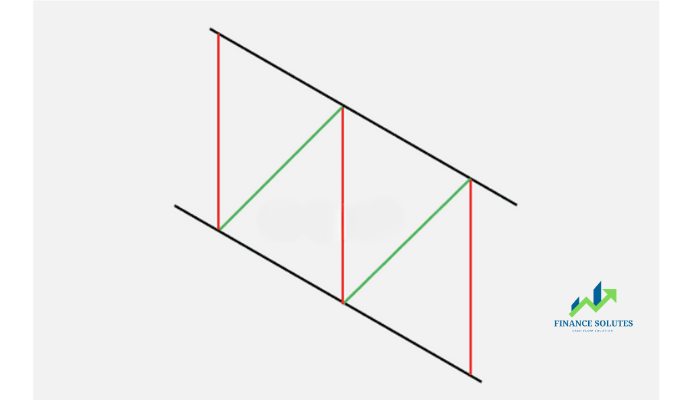
The Equidistant Channel is one of the most favored technical trading patterns among many traders. It is formed by two parallel support and resistance levels. An equidistant channel can be either ascending (rising) or descending (falling), depending on the direction of the trending price action.
In this article, we’ll look at both ascending and descending channels. We’ll cover how to identify these patterns and the best forex trading methods. We’ll also summarize everything, including how to use this pattern on a weekly chart to help shape directional trends on lower time frames. Let’s dive in!!!
1. EQUIDISTANT CHANNEL
Before discussing how to trade this pattern, we need to understand what an Equidistant Channel is, as well as the characteristics that make it work. An Equidistant Channel is formed when price action finds support and resistance between two parallel trend lines.
Although the name might sound complex, the term “equidistant” can be interpreted as “equal distance.” This refers to the parallel trend lines being evenly spaced apart. First, let’s examine an ascending equidistant channel. This is also known as a rising channel when in an uptrend.
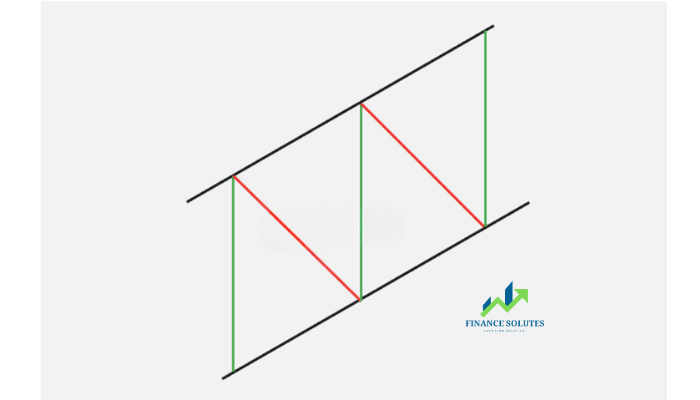
Note in the illustration above, we have a market that consistently forms higher highs and higher lows. This represents an ascending equidistant channel.
2. HOW TO IDENTIFY THE BEST EQUIDISTANT CHANNELS
Just like everything else in forex trading, becoming good at something requires practice. Learning how to quickly identify and profit from shifting price action is no different.
That said, identifying an equidistant channel is relatively simple once you know what to look for. The best approach is to start by spotting a clear trendline. Then, see if a parallel trendline is being respected by the market. In other words, if you know how to draw a trendline, you’ll know how to spot equidistant channels. Let’s take a look at an example.
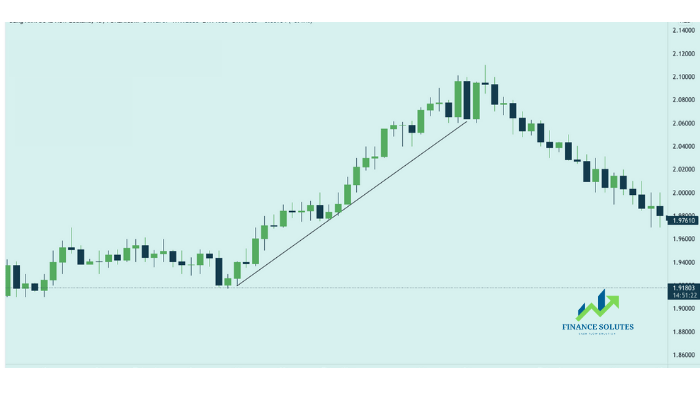
Note in the 4-hour GBPNZD chart above, we have a clearly defined support level in the form of a trendline. This level is fairly easy to spot, even for those with no formal training. Now that you’ve drawn your support line, we can begin looking for a parallel resistance level. Let’s see if something lines up…
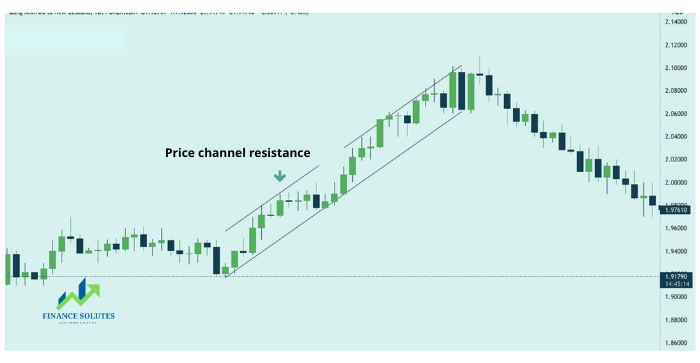
Note how the price action above is not only looking for support at the trendline we identified earlier, but also looking for resistance at the trendline drawn similarly to the support. Now that we’ve identified the equidistant channel, you can begin searching for price action signals within the pattern.
3. USING THE EQUIDISTANT CHANNEL TO FIND TRADING SETUPS
The first thing you want to know about searching for trade setups within an equidistant channel is that you always want to try and trade with the trend. A channel is essentially a trending market. Therefore, the same rules apply when it comes to trading with momentum.
This is always true as long as the market stays within the channel. There are exceptions to this rule, which we’ll look at later in the article. Let’s take a look at another GBPNZD example to see if we can find a bullish signal at the support zone.
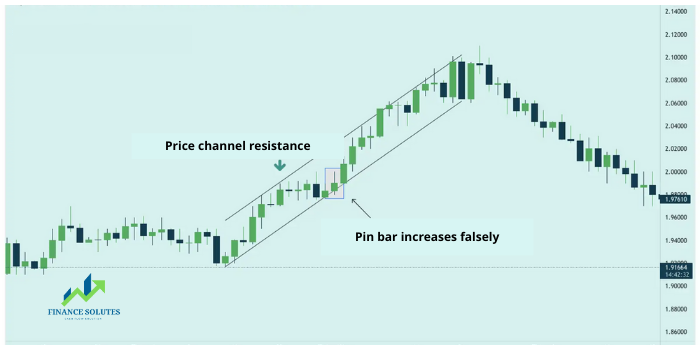
Note the chart above. After two touches of the support level, the market formed a bullish Pinbar. This Pinbar formed within the uptrend of the equidistant channel, making it a valid buying opportunity.
A reasonable target for this trade is the channel’s resistance level; it took 3 days for the market to reach that point.
Note: This trade did experience a slight pullback during the process. However, it still resulted in an extremely profitable outcome for disciplined traders.
4. EXCEPTIONS
Of course, there will be exceptions when trading trends. Equidistant channels are great for finding trade setups within the channel, but what happens when the market breaks through support or resistance?
When this happens, we can essentially treat it like a breakout strategy. This means we are monitoring the break of support or resistance with the intention of trading in the direction of the breakout. It’s important to note that these breakout strategies are best traded as follows:
-
Ascending channels (bullish) – look for a break of the channel’s support.
-
Descending channels (bearish) – look for a break of the channel’s resistance.
Let’s take a look at a breakout that occurred at the support level after the price moved within the ascending channel.
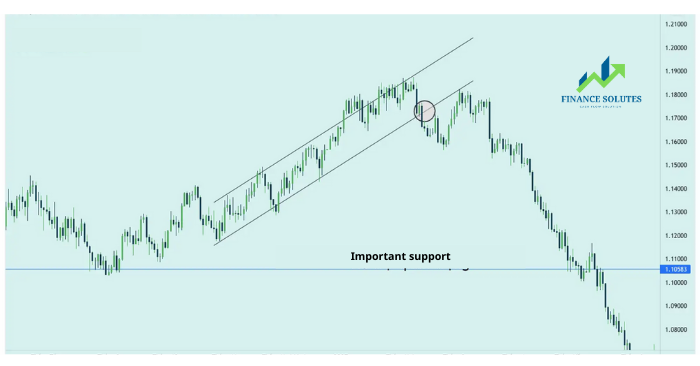
In the chart above, GBPNZD broke through the channel support early in the week. The market then moved higher to retest the previous support level, which has now acted as resistance. This trade is still in progress, but a sell order from the retest of the old support would have netted you over 500 pips. This is the power of using a simple price action model combined with higher timeframes, such as the 4-hour chart.
5. USING CHANNELS TO ESTABLISH TRENDS
Another way to use equidistant channels is to create a directional bias for a specific market. This is achieved by applying the channel to higher timeframe analysis, such as the weekly chart.\
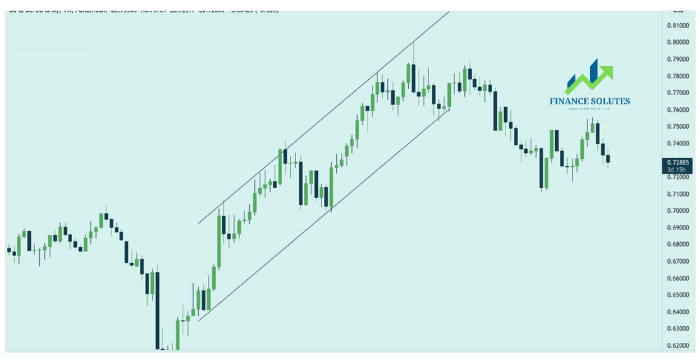
By incorporating a higher timeframe, you gain a broader view of the market’s structure and trend. This helps to refine your entries and set more reliable targets.
The chart above shows the weekly chart of AUDUSD. The pair is currently moving within an equidistant channel. This is important because it allows us to determine the uptrend or downtrend depending on the market’s position within this channel. A move down to the channel support would prompt us to look for a potential reversal on the daily timeframe.
On the other hand, a move below the channel support would make us look to lower levels, while a move above the channel resistance would prompt us to seek buying opportunities on the daily chart. Think of using equidistant channels in this way as another tool to tilt the odds in your favor. If you know where the market is likely to move weekly, trading with the trend on the daily and 4-hour timeframes becomes much easier.
6. SUMMARY
I hope this lesson has clarified the knowledge around equidistant channels, including how to identify these patterns and how to trade them. Remember that you can also use this pattern on the weekly timeframe to establish medium and long-term trends. Here’s a summary of some key points from the article:
- The term “equidistant” can be seen as “equal distance.”
- An equidistant channel is formed by two parallel trendlines, where one acts as support and the other as resistance.
- The best way to identify this pattern is to start by drawing a trendline. Then check if the parallel level matches the price action on the chart.
- Always try to trade in the direction of the equidistant channel as long as the market remains within the pattern.
- Look for bullish price action in an ascending channel and bearish price action in a descending channel.
- A break of support or resistance can lead to a breakout setup in the direction of the price break.
- For breakouts, look for a break at the support level for ascending channels and at the resistance level for descending channels.
- An equidistant channel on a weekly technical analysis chart can help shape the primary trend on the daily and 4-hour charts.
- t.me/finance_solutes
- Website: https://finance-solutes.com
- Hotline: +1 929 5636 439 ( Hotline )
- 26 Broadway, Suite 934, New York, 10004, US
