
 XM
XM Bybit
Bybit Binance
 Robinhood
 Webull
 IC Markets
 Pepperstone
 OKX
OKX Vantage
 VT Markets
 BingX
BingX Gate.io
 Kucoin
 MEXC
MEXC Exness
 Bitget
Price Analysis on Naked Forex Charts – Trading Involves More Than Just Opening a Chart and Looking for an Entry Signal. In reality, a skilled price action trader knows how to set up and analyze their charts in such a way that they may not even need a specific “price action pattern” or “signal” to find an entry point.
The underlying trend is defined by market structure; that is, trends, key levels, etc., can often provide us with enough clues to identify potential entry points. Therefore, learning how to identify the components of technical analysis is extremely important.
Today, we’ll explore how to conduct daily and weekly chart analysis. The pieces of this puzzle include: a price chart, significant support/resistance levels, trend, price action, and signals. These are the key areas that traders should focus on when performing market analysis. The reason is that learning how to properly analyze the market is crucial to understanding how to build a Price Action strategy.
1. USING A “NAKED” CHART AND HOW TO SET IT UP
Naked charts or indicator-free charts are the backbone of technical analysis and price action. If you don’t know why, try removing all indicators from your chart. Trade less, but gain more.
1.1. Chart Setup Guide
Here’s a simple way to properly set up your charts:
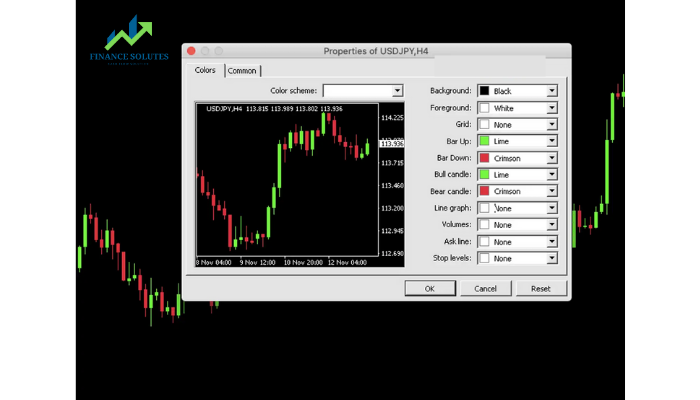
First, right-click on the chart and select “Properties” at the bottom of the menu. Then, you’ll see a screen like the image below showing chart options. First, set the colors and options as shown below:
Then, click on the “Common” tab and configure the settings as shown in the image below:
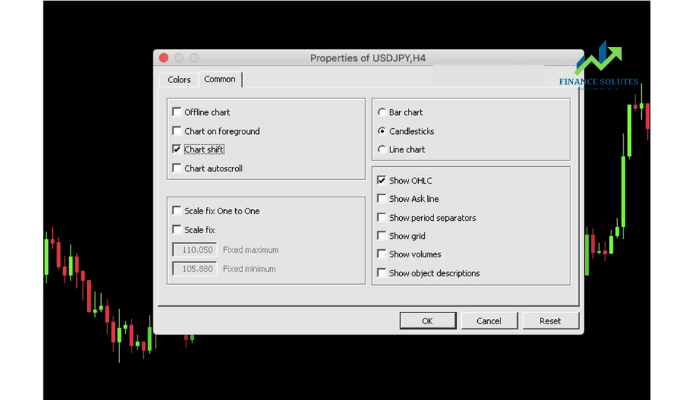
That’s a quick overview of how to set up candlestick charts like mine. There’s a reason why I keep them so simple: because in trading, simplicity is better. That means you’re trying to eliminate anything that could confuse or cause doubt.
2. PRICE ANALYSIS METHOD ON NAKED CHARTS
2.1. Step 1: Zoom in on the chart and observe the data
The first thing to do is zoom out to view the daily chart, as this gives you a broader perspective. It provides an excellent idea of what has happened, which may influence the current price action.
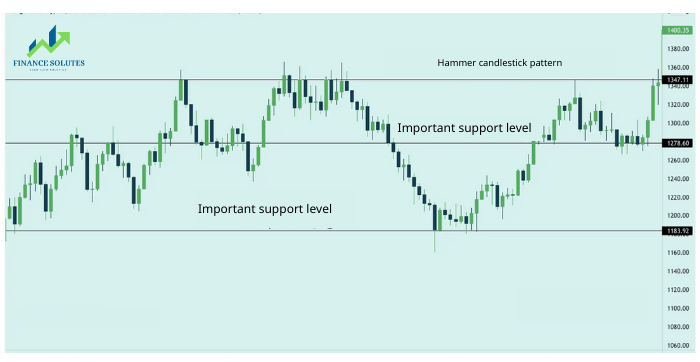
The chart below has most of the key support and resistance levels marked. Note that these price levels often flip from support to resistance or vice versa.
This allows you to review a wide time range and examine how price levels and trends have developed over the past year—commonly referred to as price action, because it leads us to the current moment. You’ll see what tradafx has drawn on the chart below. These are the most relevant resistance levels, accumulation zones, and trending price actions. This is also the first thing you should look for when analyzing price action.
2.2. Step 2: Zoom in and go deeper into the details
Next, we’ll zoom in slightly, but still focus on the same key levels. Now, we’ll dive a bit deeper into the specifics.
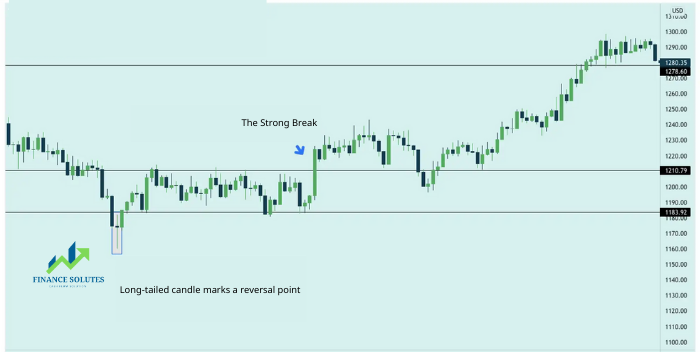
First, pay attention to the bullish candlestick tail on the far left of the chart—this is clearly a major turning point from a downtrend to an uptrend. Therefore, we’ll draw a level at the lowest price of that candle, as this level will become relevant if the price returns to that area.
Then, notice how the price entered a sideways accumulation phase for nearly two months before eventually breaking out of that range.
However, after the breakout, the price moved slowly higher and then formed a bearish pin bar candle at the 1237.00 level—a resistance zone we had previously marked on the chart.
Although this is considered a “counter-trend” pin bar, since it formed at a significant level already marked on the chart and had a clear target below the previous breakout zone around 1212.00, experienced price action traders might have considered a short trade aiming for a move back to that level.
Note: The 1212.00 level—or the 1212.00–1205.00 zone—was a strong support area due to the earlier breakout.
Next chart: Let’s observe how the market behaves as it moves, and then look at how that price level sets up for a pullback trade in line with the current market momentum.
Pay close attention to the area marked “wait for pullback”—we’ll monitor price as it pulls back to these zones after breaking above them, to look for buy entries that align with the clearly established bullish momentum. Ideally, we’d receive a price action signal at these levels after the price pulls back to them—but that’s not always necessary.
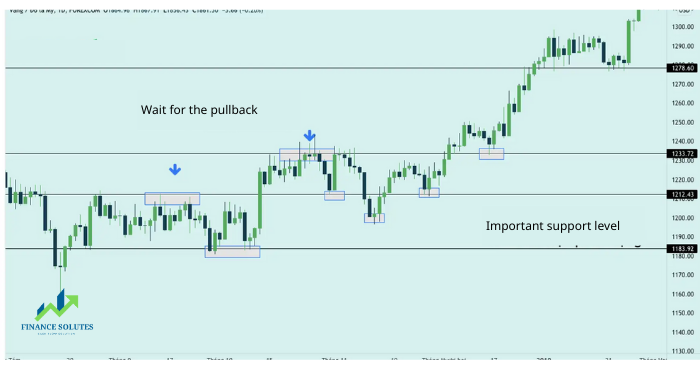
2.3. Step 3: Zoom in to the most recent price action on the chart
Finally, we zoom in to the most recent price section on the Gold chart.
From this view, we can observe a pair of potential entry signals that formed after a pullback to the 1212.00 and 1237.00 levels. Once again, we had already marked these levels on our chart and were waiting to “act” if the price returned to this zone. At that point, the price was fluctuating just below the resistance area around 1305–1295.
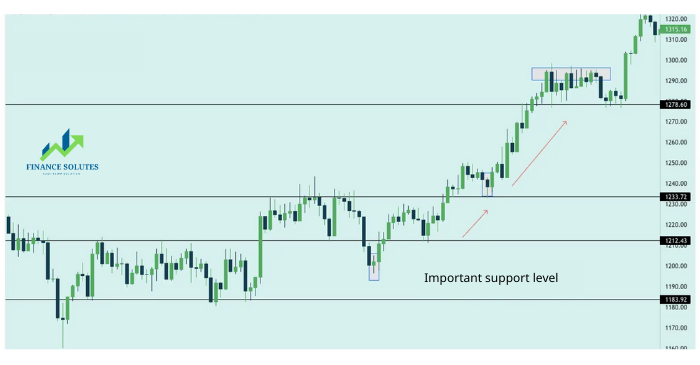
3. SUMMARY
You want to start with the higher timeframes and then move down to the lower ones. You do this to get a broader view of the market. What is happening recently only makes sense in the context of the bigger picture. Think of weekly and daily market analysis like reading a book—to understand what’s on page 100, you must first read and understand pages 1 through 99.
In reality, trading is no different! You have to build a story in your mind from the market you’re analyzing. You do this by zooming out, identifying zones, and analyzing price action. Then, you catch up with the market each day as it closes, adjust zones or add new ones if necessary.
Once you start doing this regularly, it will become your forex trading habit—price analysis on naked charts in Forex. Before long, you’ll start to truly enjoy it, and staying in tune with the market will become exciting. So, enjoy the process, but recognize that what you’re doing is keeping up with the market and its price action—and this is absolutely essential if you want any chance at learning to trade like a pro.
- t.me/finance_solutes
- Website: https://finance-solutes.com
- Hotline: +1 929 5636 439 ( Hotline )
- 26 Broadway, Suite 934, New York, 10004, US
