
 XM
XM Bybit
Bybit Binance
 Robinhood
 Webull
 IC Markets
 Pepperstone
 OKX
OKX Vantage
 VT Markets
 BingX
BingX Gate.io
 Kucoin
 MEXC
MEXC Exness
 Bitget
The Spinning Top Candle is one of the Japanese candlestick patterns widely used due to its distinct characteristics. This pattern often signals market indecision; the spinning top candle can also provide valuable supporting information for trading strategies. Let’s dive into the details of the characteristics and how to trade the spinning top candle in today’s article.
1. WHAT IS A SPINNING TOP CANDLE?
The spinning top candlestick pattern, also known as the “spinning top” pattern, features a small body located in the middle of the candle’s full length. The spinning top pattern reflects indecision about the future direction of price movement.
The spinning top is identified by a short candle body (where the open and close prices are close together) and is surrounded by two long wicks (approximately equal in length) on both sides. A spinning top can either be a bullish candle (bullish spinning top) or a bearish candle (bearish spinning top pattern). On actual charts, spinning top candles may appear in uptrends, downtrends, and/or consolidation phases (sideways movements).
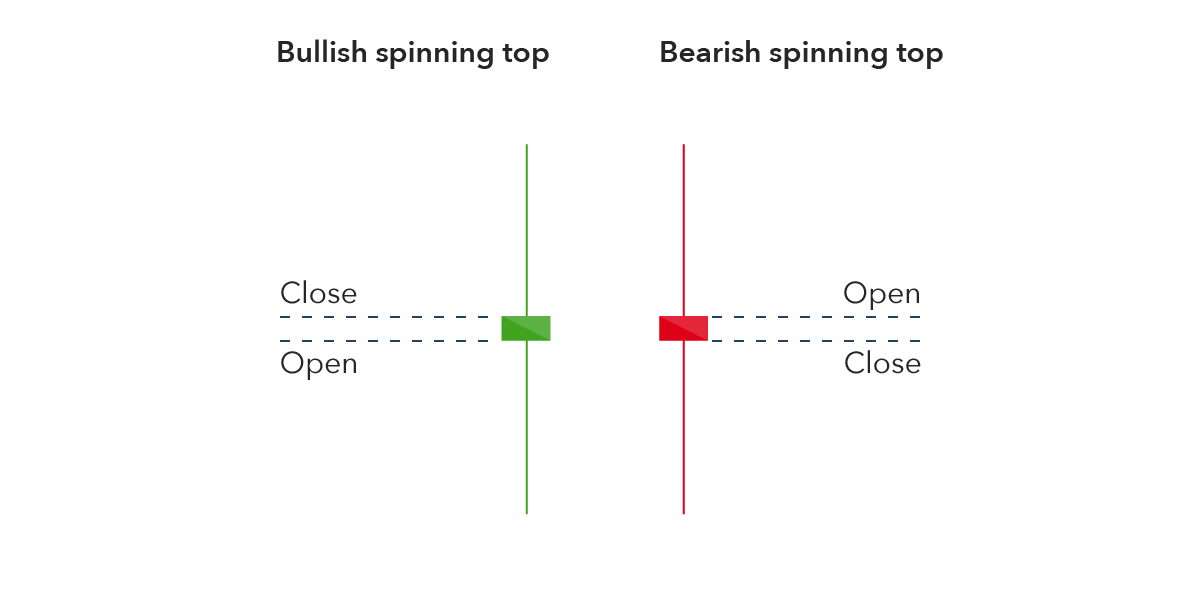
Just like all candlestick patterns, the spinning top includes a wick and a body:
- The wick of the spinning top is formed by vertical lines, while the body is formed by horizontal lines.
- The length of the wick may vary, with the upper part representing the highest price and the lower part showing the lowest price.
- The body of the spinning top may also differ in height. It reflects the difference between the opening and closing prices.
1.1. Meaning of the Spinning Top Pattern
Spinning top candlestick patterns signal market price indecision. The upper and lower shadows indicate that the bulls pushed prices significantly higher and the bears pushed them significantly lower, but in the end, the price closed near the opening level. This indecision is likely a signal that the market may enter a sideways movement. It may also signal a potential price reversal if it appears after a strong upward or downward trend.
A spinning top pattern appearing at the top of an uptrend could be a sign that the bulls are losing control, and the trend may reverse. Similarly, a spinning top at the bottom of a downtrend may suggest that the bears are losing control, and the bulls could take over the market. Confirmation comes from the next candle on the chart after the spinning top forms.
If a trader believes that a spinning top following an uptrend could lead to a reversal into a downtrend, then the candle following the pattern should show a price decline. Without confirmation after the pattern, the reversal is not validated, and the trader should wait for another trade signal.
1.2. Spinning Top vs. Doji Candlestick Patterns
Both spinning top and doji candlestick patterns represent market indecision. The doji is smaller, with a very tiny body and short upper and lower shadows. The spinning top, on the other hand, has long upper and lower wicks, with the body positioned in the middle of the candle. Both spinning tops and dojis appear frequently and are sometimes used to signal a possible reversal after a strong price move. For trading purposes, both require confirmation from the next candlestick.
2. HOW TO TRADE THE SPINNING TOP PATTERN
Trading with spinning top patterns involves understanding how they are formed and their position in relation to the overall market trend. The example below illustrates how to identify, confirm, and execute a real forex trade using the Spinning Top candlestick pattern.
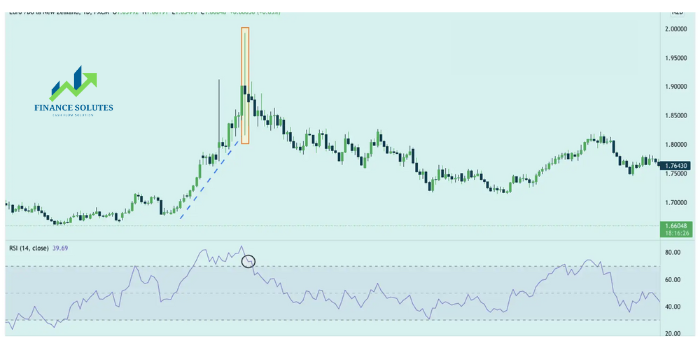
On the EUR/NZD chart above, a bearish Spinning Top candle appears at the top of an uptrend, marked by the dashed green trendline. The market is showing clear indecision between buyers and sellers, which leads to a trend reversal. Forex traders with live accounts should not enter a trade immediately after a Spinning Top forms but should delay the trade to wait for confirmation.
Confirmation can come from technical indicators, fundamental factors, or oscillators—such as using the RSI or Stochastic indicators. As shown in the image, the RSI indicator gives an overbought signal, highlighted with a circle.
The most common method used by technical traders to confirm a trend reversal is to wait for the formation of the next candlestick. Using the example above, the next candle should close lower than the spinning top pattern. If this confirmation is not present, the reversal signal may not be valid, and indecision could still persist in the market.
2.1. Limitations of the Spinning Top Candlestick Pattern
The spinning top is a pattern that appears frequently on charts and is quite common in the market. This means that many occurrences may not be effective. Many spinning top patterns will not lead to a reversal. Confirmation is essential, but even with confirmation, there is no guarantee that the price will continue in the new direction after the pattern completes.
Trading around a spinning top pattern can also present some challenges, as the candle may have a wide range from its high to low price. If confirmation occurs after the spinning top has completed and a trade is placed, setting a stop-loss above or below the high/low of the spinning top could involve significant risk—without necessarily justifying the potential reward.
Evaluating the profit potential of a spinning top trade is also difficult because the candlestick pattern does not provide a price target or exit strategy. Traders need to use other patterns, strategies, or candlestick indicators to identify a favorable exit point.
2.2. Key Takeaways for Trading the Spinning Top Pattern
– Identify candles with small bodies and long wicks on both sides
– Determine the market trend using trendlines or technical indicators
– Wait for confirmation before entering the trade
– If the spinning top is confirmed, place the trade in your desired direction
3. CONCLUSION
In summary, the Spinning Top candlestick pattern reflects market indecision between buyers and sellers. It can also signal that the market price may be about to reverse. It’s important to recognize the position of the spinning top within the market—within a trend or at key support/resistance levels.
The Spinning Top is considered most effective when it appears at these critical levels. When looking to enter a trade, it is crucial to wait for trade confirmation after the spinning top. If possible, combine the spinning top with other technical indicators in your forex knowledge to help minimize risk.
Wishing you smooth and successful trading!
- t.me/finance_solutes
- Website: https://finance-solutes.com
- Hotline: +1 929 5636 439 ( Hotline )
- 26 Broadway, Suite 934, New York, 10004, US
