
 XM
XM Bybit
Bybit Binance
 Robinhood
 Webull
 IC Markets
 Pepperstone
 OKX
OKX Vantage
 VT Markets
 BingX
BingX Gate.io
 Kucoin
 MEXC
MEXC Exness
 Bitget
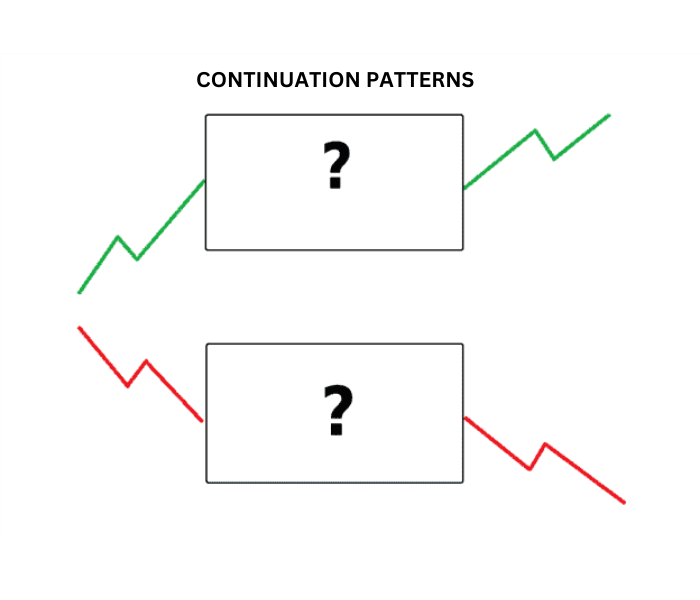
Continuation patterns can provide favorable entry points to trade in the direction of the prevailing trend. Let’s explore more about trading methods with continuation patterns and the best bearish and bullish patterns to incorporate into your forex knowledge.
1. WHAT ARE CONTINUATION PATTERNS?
Continuation patterns are easily recognizable chart patterns that represent a temporary period of accumulation before resuming in the direction of the initial trend. The accumulation appears as sideways price movement. The pattern is complete when there is a strong breakout from the accumulation zone, leading to the continuation of the prior trend. Continuation patterns typically occur over short to medium-term periods.
2, BULLISH CONTINUATION PATTERNS
Bullish continuation patterns occur within an uptrend and can be easily identified. Below are the main bullish continuation patterns.
2.1. Ascending Triangle Pattern
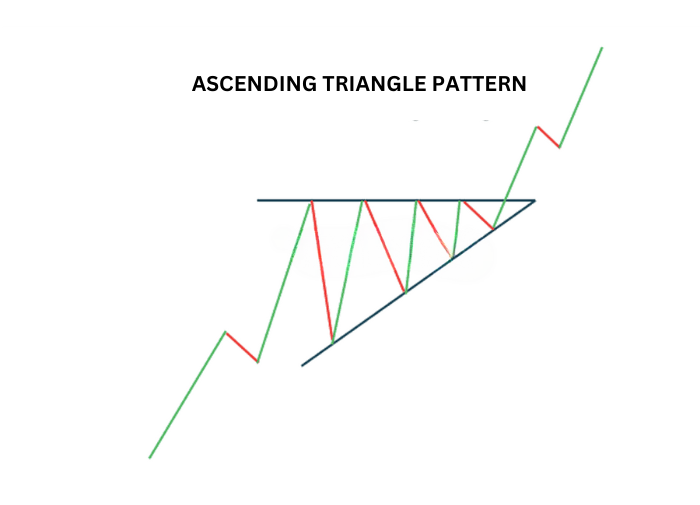
The ascending triangle pattern is an accumulation pattern that forms within an uptrend and typically signals the continuation of the current trend. The pattern is formed by drawing two converging trendlines (the upper trendline connecting the peaks and the lower trendline connecting the ascending troughs), as the price temporarily moves sideways. Traders look for the next breakout, in the direction of the previous trend, as a signal to enter the market.
2.2. Bullish PENNANT Pattern
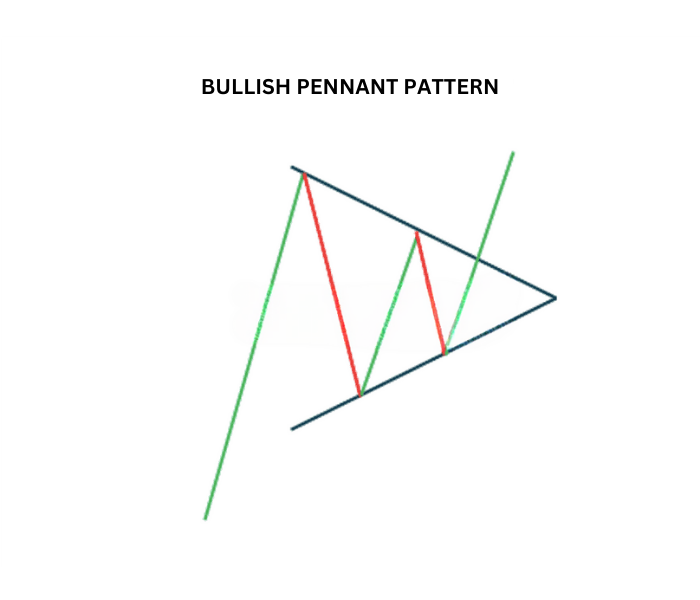
The bullish pennant pattern is a continuation chart pattern that appears after the market experiences a sharp and strong upward move. It develops during a short period of accumulation before the price continues in the direction of the trend with the same initial momentum.
The pennant pattern is formed by several candlestick legs and can often be confused with a symmetrical triangle pattern.
2.3. Bullish Flag Pattern
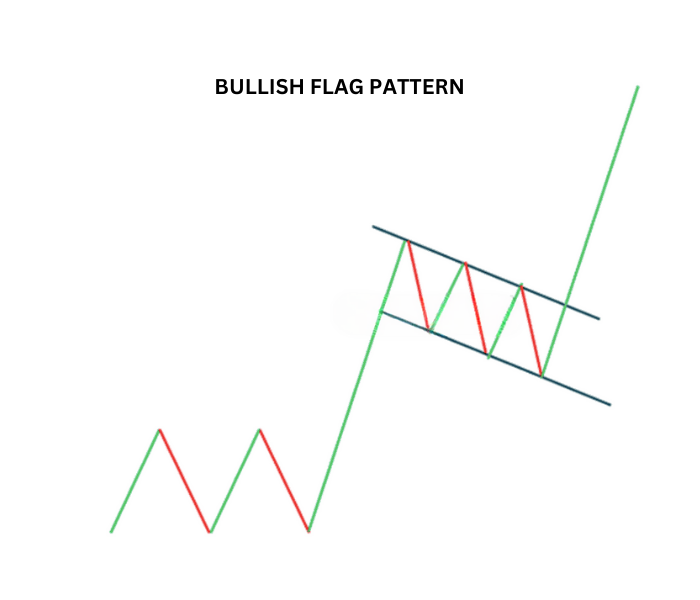
The bullish pennant pattern is an excellent pattern that traders should master. Strong moves are often associated with the bullish pennant pattern because it provides a temporary pause before the initial strong move continues. Both the pennant and flag patterns appear under similar conditions (sharp and sudden price movements); however, the pennant pattern can offer more attractive entry points.
The bullish pennant is characterized by a downward-sloping region marked by two parallel trendlines that are against the previous trend.
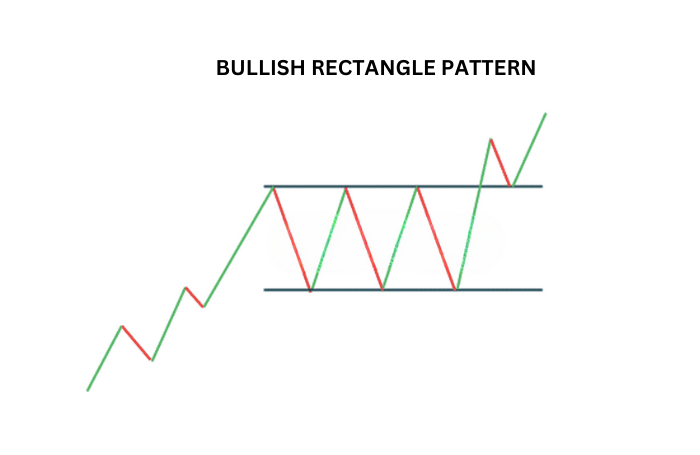
2.4. Bullish Rectangle Pattern
The bullish rectangle pattern is characterized by a pause in the trend, where the price moves sideways between parallel support and resistance levels. This pattern indicates accumulation before the price continues in the direction of the current trend. An additional benefit of this pattern is that traders have the opportunity to trade within the range or trade the breakout at the pattern’s conclusion—or both.
3. BEARISH CONTINUATION PATTERNS
Bearish continuation patterns occur within a downtrend and can be easily identified. The bearish versions of the patterns introduced above have the same impact but in the opposite direction. Below are the typical bearish continuation patterns.
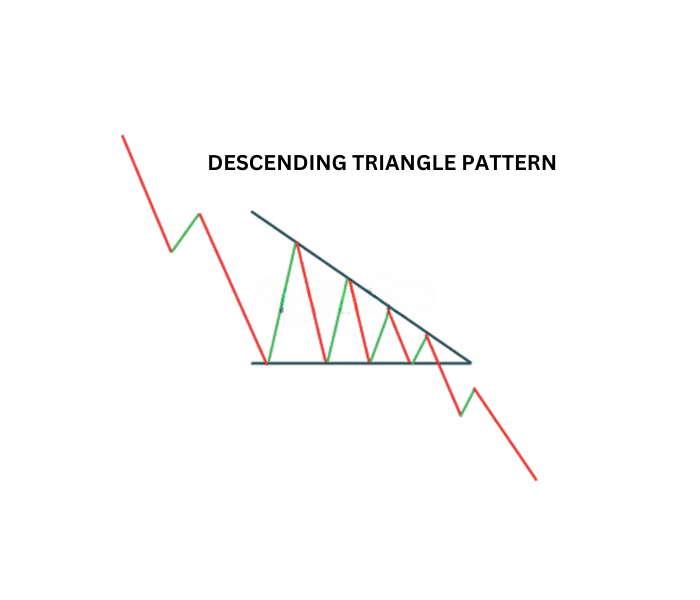
3.1. Descending Triangle Pattern
The descending triangle pattern is an accumulation pattern that forms within a downtrend and typically signals the continuation of the current downtrend. The pattern is formed by drawing two converging trendlines (the upper trendline connecting the descending peaks and the lower trendline connecting the flat troughs), as the price temporarily moves sideways. Traders look for the next breakout, in the direction of the previous trend, as a milestone to enter the market.
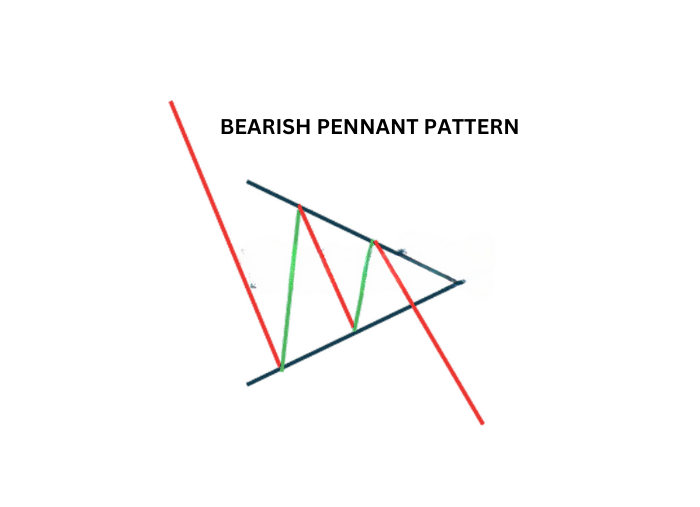
3.2. Bearish Pennant Pattern
The bearish Pennant pattern is a continuation chart pattern that appears after the market experiences a sharp and sudden downward move. It develops during a short accumulation period before the price continues lower, in the direction of the prevailing trend.
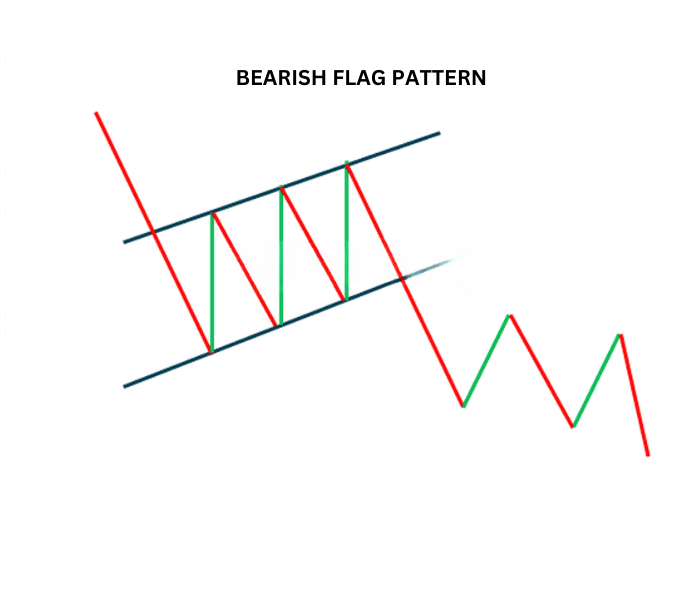
3.3. Bearish Flag Pattern
Similar to the bullish pennant, the bearish pennant pattern is often associated with explosive moves both before and after the pennant appears.
The bearish Flag is characterized by an upward-sloping region marked by two parallel trendlines that are in the opposite direction of the prior trend. This pattern should not be confused with the rectangle pattern. The flag is completed in a much shorter period (from one to three weeks) compared to the rectangle pattern and has a noticeable slope.
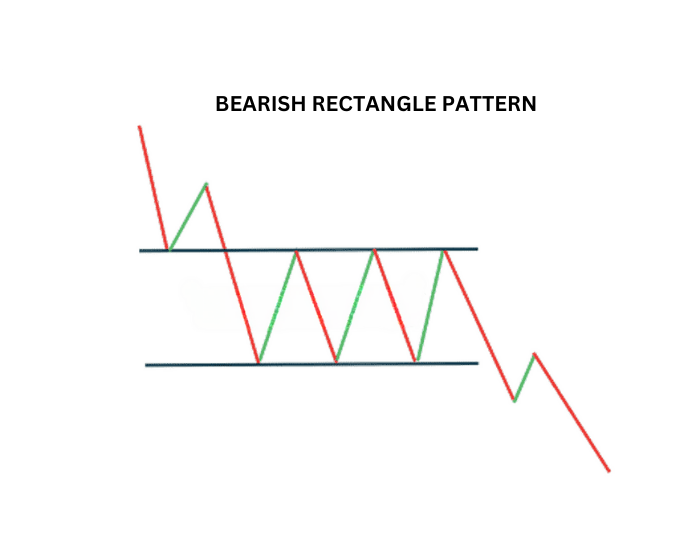
3.4. Bearish Rectangle Pattern
The bearish rectangle pattern is characterized by a pause in the trend, where the price moves sideways between parallel support and resistance levels. This pattern indicates price accumulation before continuing in the direction of the current downtrend. Traders have the opportunity to trade within the range or trade the breakout at the pattern’s conclusion—or both.
4. HOW TO TRADE CONTINUATION PATTERNS
Continuation patterns tend to be good indicators of future price movement, as long as traders follow these steps:
- Identify the direction of the trend before the price begins to consolidate.
- Use trendlines to identify which continuation pattern may be developing.
- After successfully identifying the continuation pattern, set appropriate stop-loss and take-profit levels, while adhering to a positive risk-to-reward ratio.
- Traders may wait for a strong breakout in the direction of the trend before entering. Additionally, traders should consider setting a tight stop-loss to avoid false breakouts and monitor this stop if the market moves in their favor. Consider implementing this and other risk management strategies.
5. CONTINUATION PATTERNS IN FOREX & STOCKS
Yes, the same continuation patterns apply to both forex and stock trading. Although there are notable differences when comparing forex and stocks, continuation patterns can be applied with the same confidence. It’s not about the market itself but about what the pattern reveals regarding price action.
- t.me/finance_solutes
- Website: https://finance-solutes.com
- Hotline: +1 929 5636 439 ( Hotline )
- 26 Broadway, Suite 934, New York, 10004, US
