
 XM
XM Bybit
Bybit Binance
 Robinhood
 Webull
 IC Markets
 Pepperstone
 OKX
OKX Vantage
 VT Markets
 BingX
BingX Gate.io
 Kucoin
 MEXC
MEXC Exness
 Bitget
The Triangle pattern is one of the leading continuation patterns that appear in the middle of a trend. Traders anticipate that the market will continue in the direction of the larger trend and develop trading strategies accordingly.
Triangle price patterns have three main variations: Symmetrical Triangle, Ascending Triangle Pattern, and Descending Triangle Pattern. These patterns commonly appear in the Forex market. They provide traders with deeper insights into future price movements and the potential continuation of the current trend. However, not all triangle patterns are interpreted in the same way.
1. WHAT IS A TRIANGLE PATTERN?
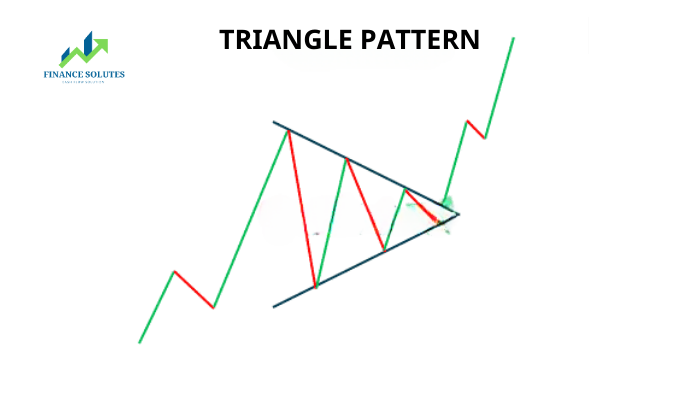
The Triangle Forex pattern is an accumulation pattern that forms within a trend and often signals the continuation of the current trend. The triangle pattern is created by drawing two converging trendlines as the price temporarily moves sideways. Traders typically look for a subsequent breakout in the direction of the previous trend as a signal to enter a trade.
2. SYMMETRICAL TRIANGLE
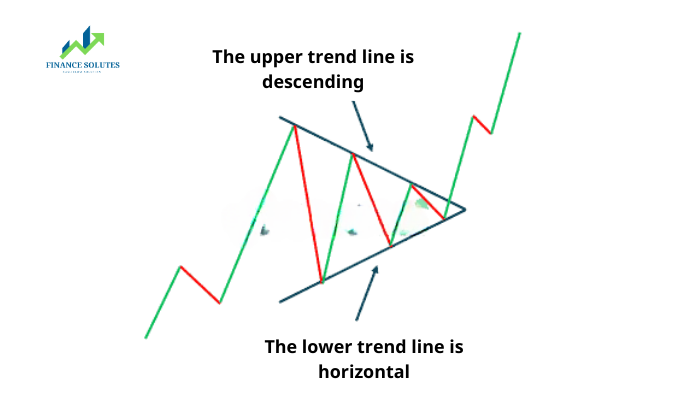
The Symmetrical Triangle pattern can be considered the starting point for all variations of the triangle pattern. As its name suggests, a triangle can be identified after drawing two converging trendlines on the chart.
The key difference between this pattern and other triangle patterns is that it is a neutral pattern, meaning it does not lean toward any specific direction. However, it still indicates the continuation of the current trend, and traders will look for breakout opportunities in that direction.
2.1. Trading Strategy for the Symmetrical Triangle Pattern
This pattern provides an effective measurement technique for trading breakouts, and this technique can also be adjusted and applied to other variations.
The AUD/USD chart below is an example of a Symmetrical Triangle pattern. The vertical distance between the upper and lower trendlines is used to estimate a suitable exit point once the price breaks out of the pattern.
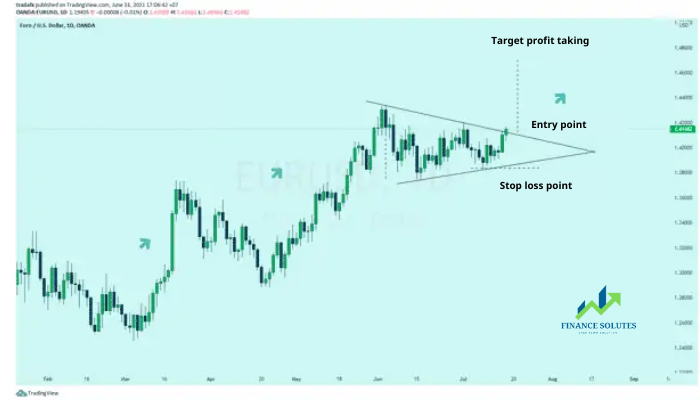
In reality, finding a perfect symmetrical triangle is extremely rare, and traders should not be too quick to dismiss imperfect patterns. They need to understand that triangle analysis is not about identifying a perfect shape but about interpreting what the market is signaling through price action.
3. ASCENDING TRIANGLE PATTERN
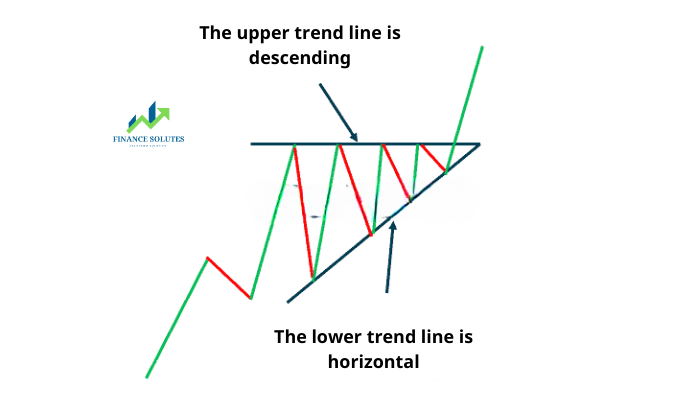
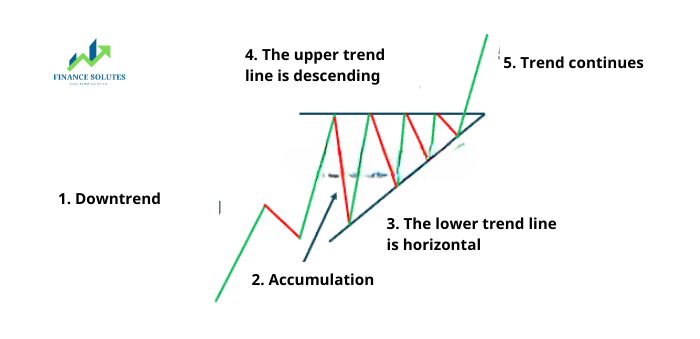
The Ascending Triangle Pattern is similar to the Symmetrical Triangle Pattern, except that the upper trendline is horizontal, while the lower trendline is ascending. This indicates that buyers are more aggressive than sellers, as the price continues to form higher lows. The more frequently the price tests the upper horizontal trendline, the higher the probability of an eventual breakout to the upside.
3.1. How to identify an ascending triangle pattern
- Uptrend: The market must be in an uptrend before the ascending triangle pattern forms. This is crucial, as traders should not trade the pattern whenever it appears, but only in the context of a prior uptrend.
- Accumulation Zone: The ascending triangle forms when the market enters a phase of accumulation.
- Rising Trendline Connecting Higher Lows: During the accumulation phase, an upward-sloping trendline can be drawn by connecting the higher lows. This rising trendline indicates that buyers are gradually pushing prices higher, reinforcing the bullish outlook.
- Flat Upper Trendline: The upper trendline acts as a resistance level. The price repeatedly tests this level and pulls back until a final breakout occurs.
- Trend Continuation: Once the price breaks above the upper trendline, traders look for confirmation of the pattern through continued bullish momentum.
3.2. How to determine the profit target in an ascending triangle
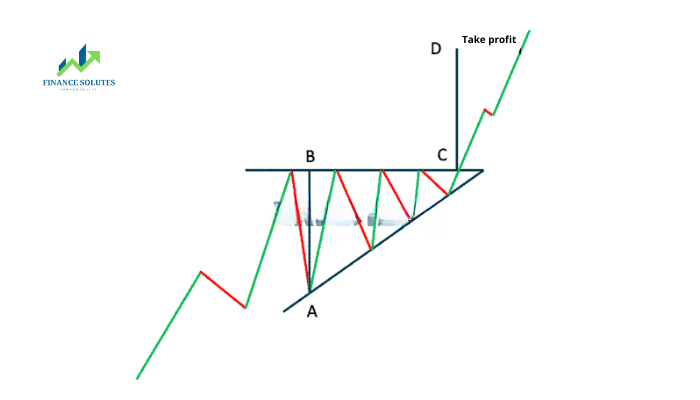
For an ascending triangle, traders can measure the distance from the start of the pattern, specifically from the lowest point of the rising trendline to the resistance level. The potential profit target will be approximately the same distance above the breakout point of the resistance level.
The illustration below shows that the distance from A to B can be projected upward, meaning the expected profit target would be from C to D.
3.3. Trading strategy for the ascending triangle pattern
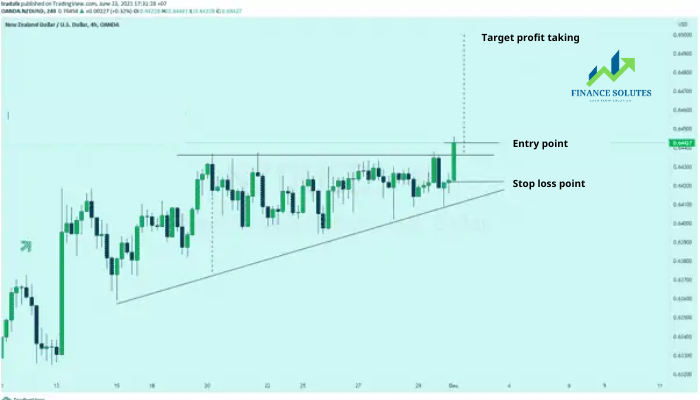
The ascending triangle can be observed in the Dollar Index example below. Starting from an existing uptrend, the price enters a consolidation phase, forming an ascending triangle. Once again, traders can measure the vertical distance between the two trendlines at the beginning of the pattern and use this measurement at the breakout point to determine the profit target. In this example, a tight stop-loss can be placed near the recent low to minimize the risk of a price reversal.
3.4. Advantages and Limitations
Advantages:
- Easily identifiable pattern
- The ascending triangle provides a clear profit target based on the maximum height of the pattern
- As a medium-term pattern, traders can choose to trade within the triangle, but it’s best to filter trades in the direction of the trend
Limitations:
- False breakouts may occur (traders need to manage risk accordingly)
- There is always a possibility that the price moves sideways for an extended period or even breaks lower
4. DESCENDING TRIANGLE PATTERN
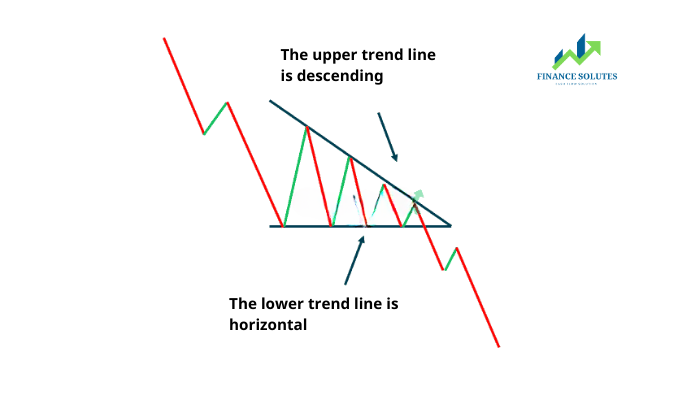
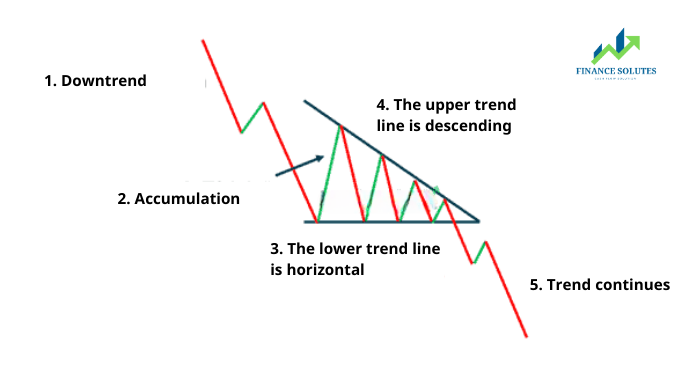
The Descending Triangle Pattern is characterized by a downward-sloping upper trendline and a horizontal lower trendline. This pattern indicates that sellers are more aggressive than buyers, as the price continues to form lower highs.
4.1. How to identify a descending triangle pattern
- Downtrend: The market must be in a downtrend before the descending triangle pattern appears. This is crucial, as traders should not trade the pattern whenever it appears, but only within the context of a prior downtrend.
- Accumulation Zone: The triangle shape forms when the market enters a consolidation phase.
- Downward-Sloping Upper Trendline: During the accumulation phase, a descending trendline can be drawn by connecting the lower highs. This downward-sloping trendline indicates that sellers are gradually pushing prices lower, reinforcing the bearish outlook.
- Flat Lower Trendline: The lower trendline acts as a support level. The price frequently tests this level and bounces back until a final breakdown occurs.
- Trend Continuation: Once the price breaks strongly below the lower trendline, traders look for confirmation of the pattern through continued bearish momentum.
4.2. Measurement method for determining profit target
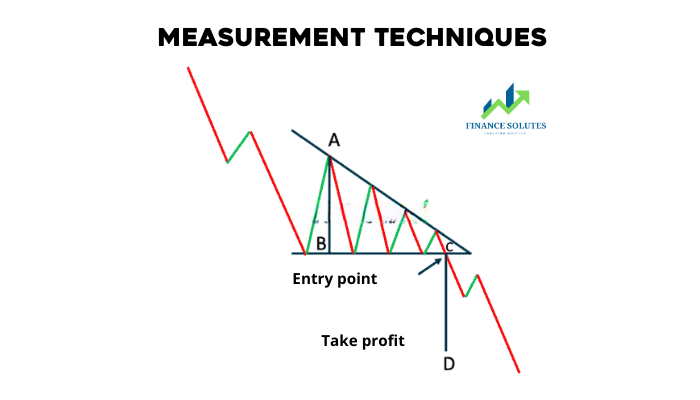
For this pattern, traders can measure the distance from the starting point of the pattern, specifically from the highest point of the triangle to the support level. The potential profit target will be approximately the same distance below the breakout point of the support level.
The illustration below shows that the distance from A to B can be projected downward, meaning the expected profit target would be from C to D.
4.3. Trading strategy for the descending triangle pattern
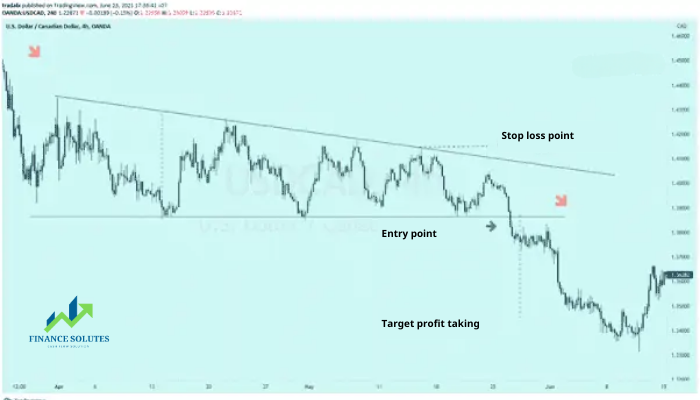
Below is a typical example of a descending triangle appearing on the GBP/USD chart. The downtrend leads to a consolidation phase, where sellers dominate buyers and gradually push the price lower. A strong breakout below the lower trendline provides traders with a selling opportunity. In this example, we observe that the price quickly moves in the opposite direction after the breakout. This highlights the importance of setting an appropriate stop-loss order.
The profit target is determined similarly, using the vertical distance measured at the start of the descending triangle formation.
4.4. Advantages and Limitations
Advantages
- The pattern is easy to identify.
- The descending triangle pattern provides clear targets – based on the maximum height of the descending triangle.
- Since this is a medium-term pattern, traders have the option to trade within the triangle but should filter trades in the direction of the trend.
Limitations
- False breakouts may occur (traders need to manage risk accordingly).
- There is always a possibility that the price moves sideways for an extended period or even rises higher.
5. SUMMARY
When trading the Triangle forex pattern, keep the following key points in mind:
- Identify the price trend before the accumulation phase when the price fluctuates within a range.
- Use the upper and lower trend lines to help determine which triangle pattern is forming.
- Apply the measuring technique mentioned above to forecast profit-taking levels.
- Follow proper risk management methods to minimize the risk of false breakouts and ensure a positive risk-reward ratio in all trades.
Wishing you success in your trading career!
- t.me/finance_solutes
- Website: https://finance-solutes.com
- Hotline: +1 929 5636 439 ( Hotline )
- 26 Broadway, Suite 934, New York, 10004, US
