
 XM
XM Bybit
Bybit Binance
 Robinhood
 Webull
 IC Markets
 Pepperstone
 OKX
OKX Vantage
 VT Markets
 BingX
BingX Gate.io
 Kucoin
 MEXC
MEXC Exness
 Bitget
In the previous article, we explored the most basic concepts of Doji candles and 5 typical variations that are frequently traded in the Forex market. However, what are the characteristics, meanings, and applications of these types of Doji candles? Let’s find out with Finance Solutes in today’s article!!
Let’s get started!!!
1. WHAT IS A DOJI CANDLE?
As mentioned in the previous article, a Doji candle is a pattern where the closing price and opening price are equal or nearly equal. Therefore, the candle body is very small, almost non-existent, appearing on the chart as a thin horizontal line. The candle wicks can be long or short, and the Doji candle shape resembles a plus sign (+).
Doji candles represent market indecision and struggle. At that time, both buyers and sellers are in a tug-of-war, and neither side can gain control of the market. Thus, throughout the trading session, even if the price fluctuates up or down, by the end of the session, the closing price remains very close to the opening price.
2. 5 TYPICAL DOJI CANDLE PATTERNS IN FOREX
These types of Doji candles are divided into 5 specific types, which are: Standard Doji, Long-legged Doji, Dragonfly Doji, Gravestone Doji, and Four Price Doji (Doji without wicks or Four Price Doji).
2.1. Standard Doji
Characteristics: The Standard Doji candle has short upper and lower wicks that are of equal length. Of course, the opening and closing prices are also equal or nearly equal. This feature creates a shape that resembles a plus sign.
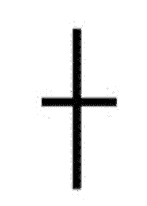
Meaning:
- The Standard Doji candle pattern is a single-candle formation. By itself, it does not carry much significance. To understand the meaning of this candle pattern, Forex traders should observe the preceding price action leading up to the formation of the Doji candle.
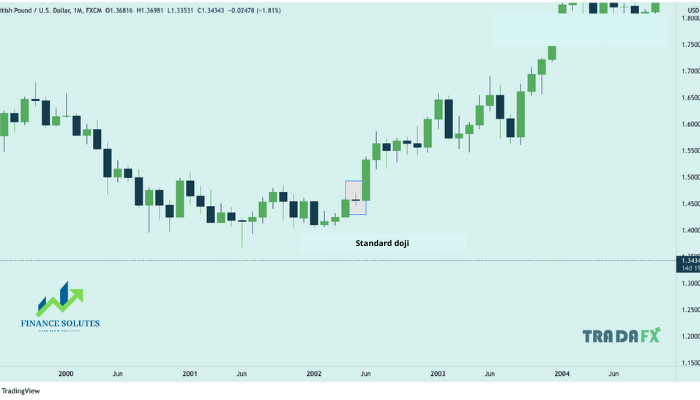
- Trading based on Doji candle patterns needs to be placed in the right context. For example: A Standard Doji in an uptrend may signal a continuation of the uptrend. However, the chart below illustrates a reversal from an uptrend. This highlights the importance of seeking confirmation after the appearance of a Doji candle.
Real-world example:
2.2. Long-Legged Doji
Characteristics: The Long-Legged Doji candle is characterized by having very long upper and lower wicks of equal length. Of course, the opening and closing prices are also equal or nearly equal.
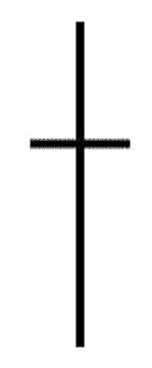
Meaning: The Long-Legged Doji candle reflects intense indecision between buying and selling pressure, therefore there is a high probability that the price will soon reverse.
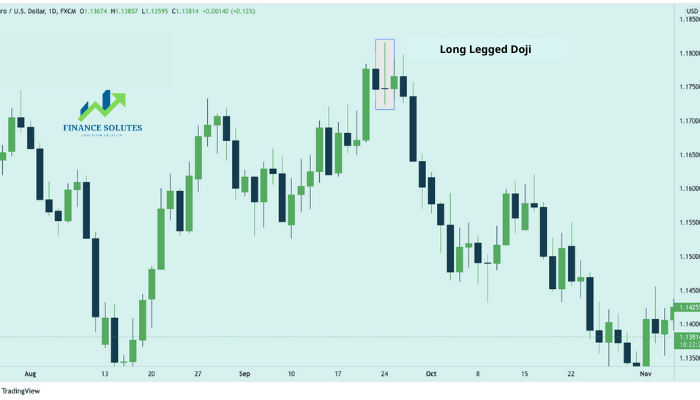
Real-world example: Take a look at the example chart below. At the point where the Long-Legged Doji appears, it is clear that the price has slightly retraced after a fairly strong downward move.
When a Long-Legged Doji appears at the top of a retracement (something we would not know at the time it forms), a trader might anticipate indecision and a potential change in direction. Afterward, one could look to sell at the opening of the next candle following the Doji. The stop loss would be placed at the top of the upper wick of the Long-Legged Doji.
2.3. Dragonfly Doji
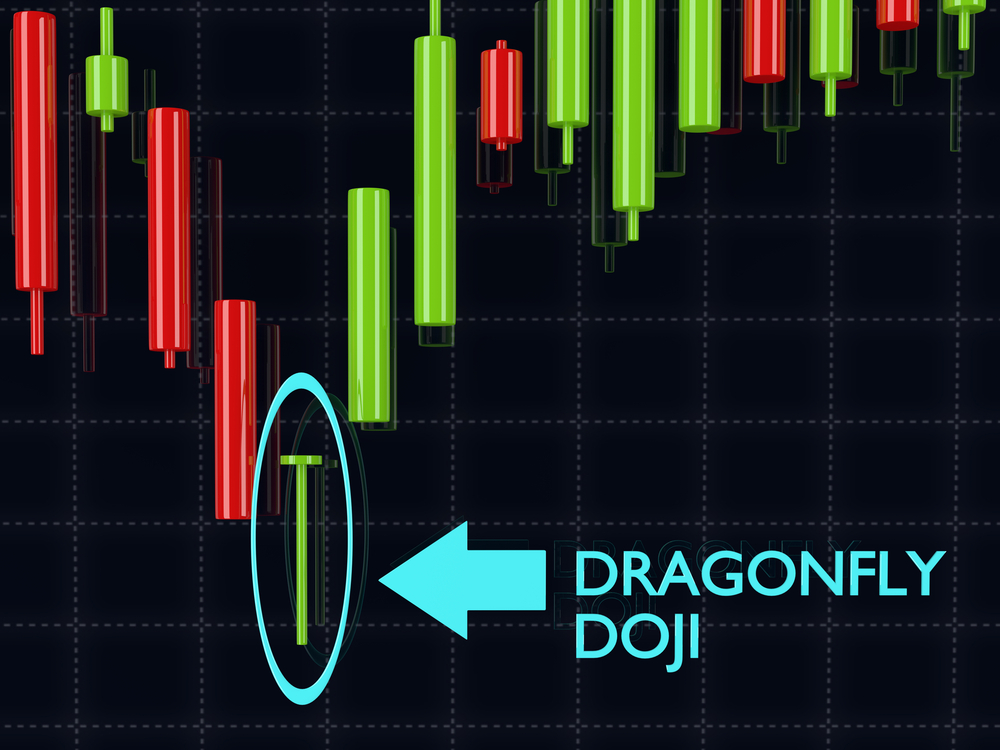
Characteristics: Among the Doji candle types, the Dragonfly Doji has no upper wick; it only has a very long lower wick. The opening and closing prices are approximately the same and are also the highest price of the session.
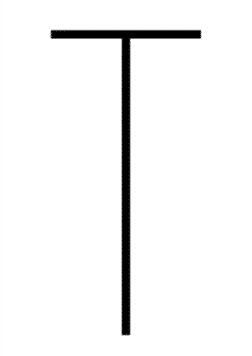
- Meaning:
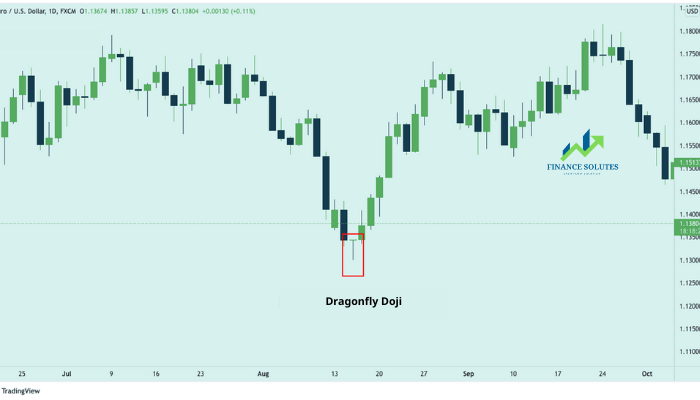
The Dragonfly Doji candle pattern can appear at the top of an uptrend or the bottom of a downtrend. It signals a potential reversal. The absence of an upper wick, forming a T-shaped candle, indicates that the price did not move above the opening level. A very long lower wick appearing at the bottom of a downtrend suggests a strong bullish signal. - Therefore, when this candle pattern appears, it shows that the buyers are gaining control with strong buying pressure, leading to either an upward continuation or a reversal from a downtrend to an uptrend.
Real-world example:
2.4. Gravestone Doji
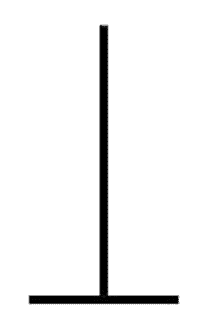
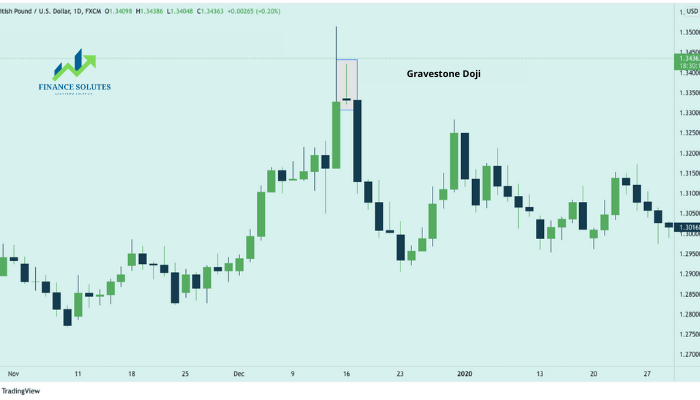
Characteristics: In contrast to the Dragonfly Doji, the Gravestone Doji pattern has no lower wick but has a very long upper wick. This appearance resembles the shape of a gravestone.
The opening and closing prices are equal and also represent the lowest price of the session.
Meaning:
- The Gravestone Doji pattern appears when the price action opens and closes at the low of the trading range. After the Gravestone Doji opens, buyers were able to push the price higher; however, by the end of the session, they could not maintain this upward momentum.
- The appearance of a Gravestone Doji at the top of an uptrend indicates a bearish signal.
- Therefore, the Gravestone Doji signals the end of an uptrend. Buying pressure has been exhausted, and sellers are gaining the upper hand. As a result, the market is likely to drop sharply afterward. However, confirmation from the next candle is still necessary.
Real-world example:
2.5. Four Price Doji
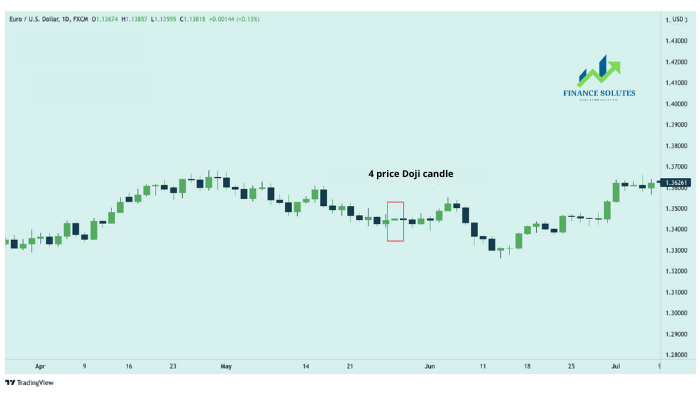
Characteristics: This Doji candle appears as a single horizontal line. The opening, closing, high, and low prices are all the same.
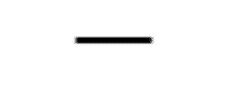
Meaning: The Four Price Doji implies strong indecision between buyers and sellers; the market may continue in this state for several sessions without an immediate reversal.
Real-world example:
3. HOW IS A DOJI CANDLE FORMED?
A Doji candle is formed when the price of a currency pair opens and closes at nearly the same level during the timeframe of the chart where the Doji appears. Although the price may have fluctuated between the opening and closing times, the fact that the candle opens and closes at almost the same price indicates that the market was unable to decide on a direction (up or down).
Note that higher-probability trades are those that are executed in the direction of the longer-term trend. When a Doji appears at the bottom of a pullback in an uptrend or at the top of a pullback in a downtrend, the way to achieve a higher probability when trading Doji candles is to follow the direction of the trend. In an uptrend, the stop-loss would be placed below the lower wick of the Doji, and in a downtrend, the stop-loss would be placed above the upper wick.
4. SUMMARY
Through Finance Solutes insights shared in this article, we hope you have gained a solid understanding of the key types of Doji candles and can easily recognize them in real-world Forex trading situations.
Wishing you great success in your trading career with candlestick patterns!!!
- t.me/finance_solutes
- Website: https://finance-solutes.com
- Hotline: +1 929 5636 439 ( Hotline )
- 26 Broadway, Suite 934, New York, 10004, US
