
 XM
XM Bybit
Bybit Binance
 Robinhood
 Webull
 IC Markets
 Pepperstone
 OKX
OKX Vantage
 VT Markets
 BingX
BingX Gate.io
 Kucoin
 MEXC
MEXC Exness
 Bitget
Continuing the series on the Fibonacci Sequence, today’s article will introduce the Fibonacci Time Zones tool. So, what exactly is the Fibonacci Time Zones tool? How does it differ from the previous Fibonacci tools you’ve learned about? And are there any important notes to keep in mind when using it? All these questions will be answered in the article below.
1. WHAT IS THE FIBONACCI TIME ZONES?
The Fibonacci Time Zones tool, also known as Fibonacci time regions, typically starts at swing highs or swing lows. This tool consists of vertical Fibonacci lines representing potential zones where reversal points may occur.
The Fibonacci numbers are a sequence of natural numbers starting with 0, 1, 2, 3, 5, 8, 13, 21, 34, 55, 89, 144, etc. The following numbers follow the Fibonacci sequence rule, where each number is the sum of the two preceding ones.
Fibonacci Time Zones is a tool developed based on the Fibonacci sequence, alongside other tools such as Fibonacci Retracements, Fibonacci Fans, Fibonacci Extensions, and Fibonacci Arcs.
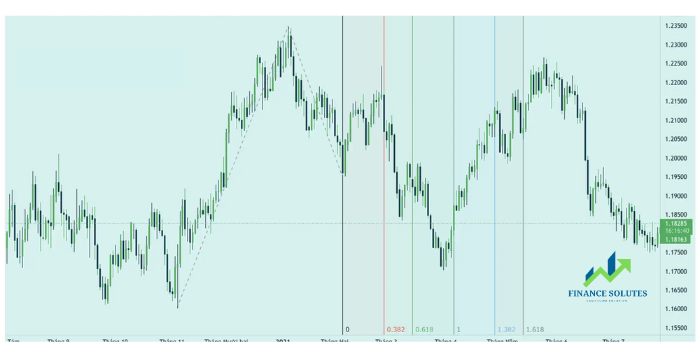
These vertical Fibonacci lines correspond to the time axis (x-axis) of the price chart, based on Fibonacci ratios. Fibonacci Time Zones are divided into two types: regular Fibonacci Time Zones and trend-based Fibonacci Time Zones. Both tools are calculated using the same principle. The difference with trend-based Fibonacci Time Zones is that they rely on the previous trend, making them potentially more objective.
The illustration above is drawn using the trend-based Fibonacci Time Zones tool. Regular Fibonacci Time Zones will be illustrated in the image below:
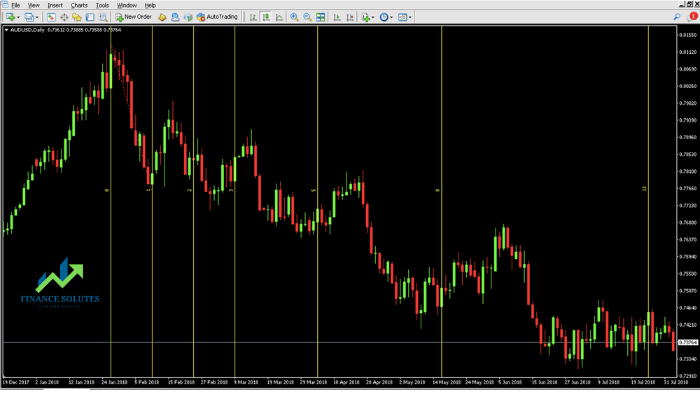
Note that the Fibonacci Time Zones tool may not precisely indicate reversal points, but it highlights important price zones that traders should pay attention to.
1.1. The Significance of Fibonacci Time Zones
Identifying the starting point when using Fibonacci Time Zones is crucial. However, selecting this starting point is somewhat subjective. The initial position or selected time frame is relatively important, marking the swing high or swing low. After drawing Fibonacci Time Zones, vertical lines will appear to the right of the first line.
The first Fibonacci Time Zone line is labeled as the 0 line. As seen in the TradaFX illustration above, the following lines correspond to the numbers in the Fibonacci sequence.
Fibonacci Time Zones can be used to confirm trading signals or analyze the market. For example, suppose the price is approaching a resistance zone that coincides with a Fibonacci Time Zone area and then bounces off the resistance — these two tools can validate each other.
Another point to note is that Fibonacci Time Zones do not indicate the speed at which prices move in the market. The market price may create a bottom and then rise significantly, or the price may only change temporarily before dropping to a new low.
1.2. Comparing Fibonacci Time Zones and Fibonacci Retracements
Fibonacci Time Zones are vertical Fibonacci lines representing future time intervals where prices may peak, bottom out, or reverse.
In contrast, Fibonacci Retracement lines can indicate areas where prices might pull back. The Fibonacci Retracement tool, based on price, provides potential support and resistance levels derived from Fibonacci ratios.
2. HOW TO DRAW FIBONACCI TIME ZONES
Next, Finance Solutes will guide you through drawing Fibonacci Time Zones on the MT4 and TradingView trading platforms:
2.1. On the MT4 Platform
The general principle for drawing Fibonacci Time Zones is as follows: In an upward trend (bullish), traders need to select two important high points (or peaks). Similarly, in a downward trend (bearish), traders need to select two significant low points (or bottoms).
First, open the Fibonacci Time Zones tool in the Menu bar -> Select Insert -> Fibonacci -> Choose Time Zones.
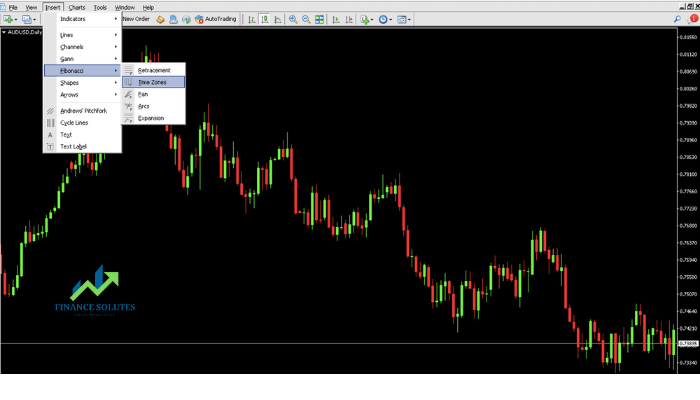
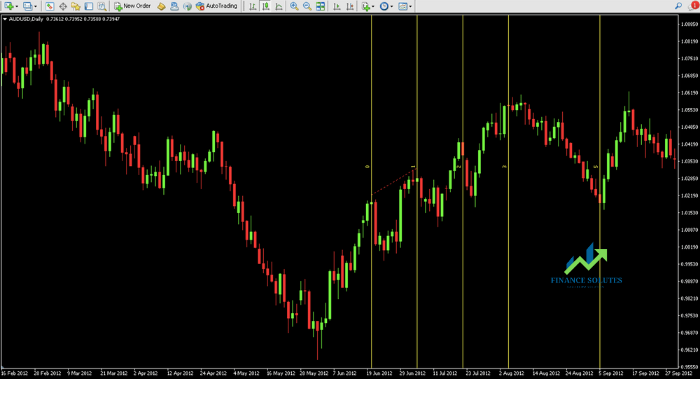
Drag the tool from one peak to another in an upward trend; and vice versa for a downward trend (from one bottom to another).
This tool counts the number of candles (time) between market reversal points and generates vertical Fibonacci lines to make predictions.
2.2. On TradingView
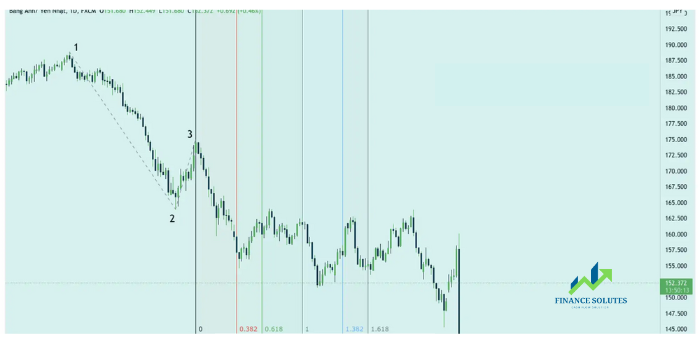
The Fibonacci Time Zones tool in TradingView is based on the previous upward or downward trend. To use this tool, you first need to draw what’s called a “baseline,” or in TradingView, it will appear as a “trendline.” This line follows the previous trend.
First, open the chart of the currency pair you want to analyze. Then, identify the primary market trend and open the Fibonacci Time Zones drawing tool based on the trend.
Next, drag the tool from the highest peak to the lowest trough (similar to drawing Fibonacci Retracements). This action creates a trendline and marks the starting point (the 0 line), representing the first price correction before continuing the new trend.
After drawing the line from points 1 to 2 and 3, the Fibonacci Time Zones lines will automatically appear to the right of the 0 line.
3. LIMITATIONS OF FIBONACCI TIME ZONES
As mentioned earlier, the Fibonacci Time Zones tool can be subjective, as the initial starting point is determined by the user. Additionally, some trading platforms allow traders to select the time representation (1), further increasing the subjectivity of this tool.
If drawn correctly, Fibonacci Time Zones can highlight time periods when prices are likely to form peaks or troughs. However, these may only be minor peaks or troughs rather than significant ones.
Fibonacci Time Zones do not provide any data on the magnitude of price movements. They also rarely pinpoint exact reversal points. Therefore, this tool is more useful when combined with other indicators, trend analysis, and price action.
4. SUMMARY
Like other Fibonacci tools (such as Fibonacci Fans or Fibonacci Extensions), using this tool alone may not be highly effective for traders. However, when combined with other tools, indicators, and analysis, it can increase the chances of making successful trades.
Hopefully, through this forex knowledge, you’ve gained a better understanding of Fibonacci Time Zones and can incorporate it with other trading tools and indicators when needed.
Wishing you smooth and successful trading!
- t.me/finance_solutes
- Website: https://finance-solutes.com
- Hotline: +1 929 5636 439 ( Hotline )
- 26 Broadway, Suite 934, New York, 10004, US
