
 XM
XM Bybit
Bybit Binance
 Robinhood
 Webull
 IC Markets
 Pepperstone
 OKX
OKX Vantage
 VT Markets
 BingX
BingX Gate.io
 Kucoin
 MEXC
MEXC Exness
 Bitget
Japanese Candlestick Patterns – one of the concepts that every trader must know when trading on financial markets. The skill of reading charts and analyzing candlestick charts has become an essential skill for traders who want to analyze the market and make trading decisions. Today’s article will help traders gain the basic knowledge that everyone needs to understand before using this popular pattern.
1. HISTORY OF JAPANESE CANDLESTICK PATTERNS
Some of the earliest technical analysis methods were used to track rice prices in the 18th century. Much of the credit for creating candlestick charts goes to Munehisa Homma (1724–1803), a rice trader from Sakata, Japan.

Hundreds of years later, trader Steve Nison is credited with popularizing candlestick charts in the West and in modern technical analysis.
Nison wrote the book “Japanese Candlestick Charting Techniques” in 1991, which is considered one of the leading works on candlestick patterns and trading strategies.
Since the 1990s, this secret Japanese candlestick pattern technique has become widely popular and remains so today.
2. WHAT IS A JAPANESE CANDLESTICK PATTERN?
A Japanese candlestick pattern, also known as a candlestick chart, is named as such because these patterns originated in Japan. Candlestick patterns are a financial technical analysis tool that describes daily price movements, represented through chart patterns. To get the clearest visual of a Japanese candlestick chart pattern, refer to the image of a candlestick below:
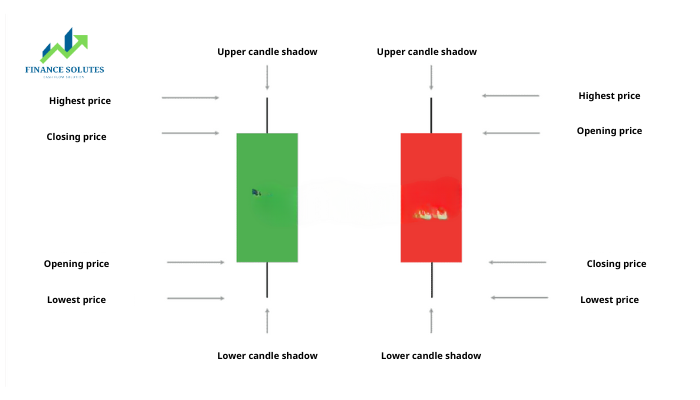
In general, a candlestick chart is simply a chart made up of individual candlesticks. Traders use these charts to understand price action.
Price action in candlestick patterns involves determining the opening and closing prices within a specific time period, as well as the highest and lowest prices during that timeframe.
Each candlestick can form its own unique pattern, which can indicate potential buy or sell points in the market. Japanese candlesticks can be used on any time frame you choose!
Forex traders need to have certain knowledge and understanding of the meaning and analysis of candlestick charts. After learning how to read Japanese candlestick patterns in forex trading, traders often find they can identify many types of effective price actions compared to using other chart patterns.
Moreover, traders can also use candlestick charts in other financial markets.
2.1. Structure of a Japanese Candlestick
There are three specific components that make up a Japanese candlestick: the opening price, closing price, and the wicks (shadows). The candlestick will turn green if the opening price is below the closing price. The candlestick will turn red if the opening price is above the closing price. Note that the color of the candlestick depends on the chart setup.
In the daily timeframe, each candlestick represents one day. The opening price is the first traded price of the day. The closing price is the last traded price of the day.
-
Opening Price: The opening price represents the first price at which a trade occurs when a new candlestick is forming.
-
Highest Price: The top of the upper wick. If there is no upper wick, the highest price is either the opening price of a bearish candlestick or the closing price of a bullish candlestick.
-
Lowest Price: The bottom of the lower wick. If there is no lower wick, the lowest price is either the opening price of a bullish candlestick or the closing price of a bearish candlestick.
-
Closing Price: The closing price is the last traded price during the formation of the candlestick.
The image below illustrates a bullish candlestick (green) and a bearish candlestick (red):
- If the closing price is higher than the opening price, a bullish candlestick will appear.
- If the closing price is lower than the opening price, a bearish candlestick will appear.
- The filled portion of the candlestick is called the “body” or the main part.
- The thin lines above and below the body of the candlestick represent the highest/lowest range, and they are called the candlestick wicks (tails): The wicks can help traders track market momentum and avoid being trapped by non-moving critical price levels.
2.2. How to Read Japanese Candlestick Charts
There are many different ways to use and read candlestick charts. Candlestick chart analysis depends on your trading strategy and preferred time frame. Some strategies try to capitalize on candlestick formations, while other strategies attempt to identify typical candlestick patterns.
2.2.1. Interpreting Japanese Candlestick Formations
Individual candlesticks can provide valuable insight into the current market sentiment.
Typical candlestick patterns like Hammer, Shooting Star, Hanging Man, etc., offer traders clues about the momentum shift and the possibility of market prices continuing or reversing.
As you can see in the image below, the formation of a Hammer candlestick sometimes indicates a potential reversal in trend. The hammer formation has a long wick below the body with a small body. Its close price is higher than its open price. The rationale behind the hammer formation is simple: the price tries to go down, but buyers jump into the market and push the price higher. This is a bullish signal, suggesting that you can enter the market, tighten your stop loss, or close a sell position.
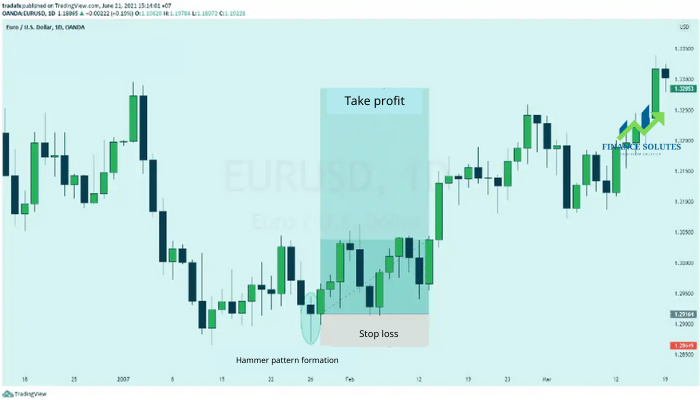
Traders can buy when the Hammer candlestick closes. The Hammer candlestick is beneficial because traders can set a “tight” stop loss. The take profit level should be set in a way that ensures a positive risk-reward ratio. Therefore, the take profit level will be larger than the stop loss level.
2.2.2. Identifying Price Patterns Formed by Multiple Candlesticks
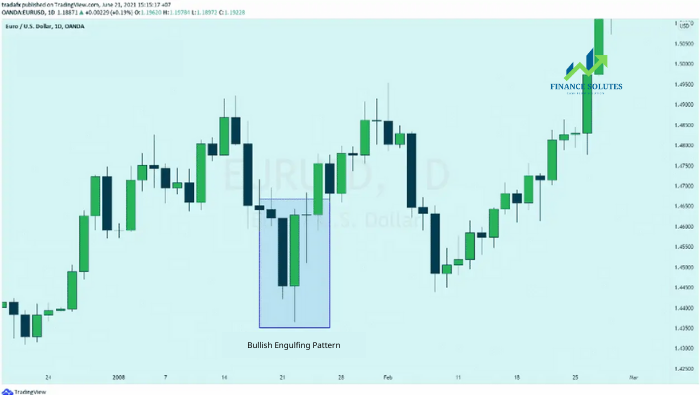
Candlestick charts help traders recognize price patterns that appear on the chart. By recognizing these price patterns, such as a Bullish Engulfing pattern or a Triangle pattern, you can use them as entry or exit signals in the market.
For example, in the image below, we have a Bullish Engulfing price pattern. This candlestick pattern is a combination of a red candlestick and a blue candlestick that “engulfs” the entire previous red candlestick. This is a sign that it could mark the end of the weakness in a currency pair. Traders can buy after the bullish candlestick closes. Remember that the price pattern is only formed when the second candlestick closes.
Similar to the Hammer candlestick formation, a trader will set a stop loss below the Bullish Engulfing candlestick, ensuring a tight stop loss. The trader will then set a take profit order to ensure a positive risk-to-reward ratio.
3. CATEGORIZING CANDLESTICK PATTERNS
Candlestick patterns can generally be categorized into three main types: bearish candlestick patterns, bullish candlestick patterns, and neutral candlestick patterns. Among the neutral candlestick patterns, the most famous forex pattern is the Doji candlestick. Below, we will go into detail about bullish and bearish candlestick patterns. Both bullish and bearish patterns are further divided into reversal patterns and continuation patterns.
3.1. Bullish Candlestick Patterns
Bullish candlestick patterns signal that the market is about to make an upward move. A bullish reversal pattern indicates that the market, which was previously in a downtrend, may be about to reverse, end the downtrend, and turn into an uptrend. Some strong bullish reversal candlestick patterns include the Hammer, Inverted Hammer, Engulfing, and Piercing Line patterns, among others.
Meanwhile, continuation patterns that appear in an uptrend indicate that market momentum has not shown any signs of weakening. Common bullish continuation candlestick patterns include the Marubozu candle and the Bullish Harami pattern.
3.2. Bearish Candlestick Patterns
In contrast to bullish candlestick patterns, bearish candlestick patterns signal that a downward move in price is about to happen. In a downtrend, bearish continuation patterns indicate that the price decline is not yet over. On the other hand, bearish reversal patterns signal that the uptrend is about to end and a downtrend is about to begin.
One of the interesting characteristics of candlestick patterns is that they often have a reverse version of the pattern. Common bearish reversal candlestick patterns include: the Hanging Man, Shooting Star, and Bearish Engulfing patterns. Common bearish continuation candlestick patterns include: the Bearish Marubozu and Bearish Harami patterns.
3.3. Continuation Candlestick Patterns
Forex traders often tend to look for reversal signals from candlestick patterns. However, one underutilized skill is how to use continuation candlestick patterns, which show that the market is pushing to continue its trend.
4. WHY CANDLESTICKS HAVE BECOME POPULAR
The first reason is that they are more visually intuitive than other types of charts. Candlestick charts highlight the opening and closing times of different timeframes more clearly compared to bar charts or line charts.
Candlestick charts have certain advantages, such as:
- Price volatility is more easily recognized on candlestick charts compared to other charts.
- It is easier to identify price patterns and price action on candlestick charts.
- Candlestick charts provide more detailed information about price (open, close, high, low) than line charts.
However, candlestick charts also have some disadvantages:
- Green or red candlesticks can mislead inexperienced forex traders because they might think the market will continue moving in the direction of the previous candle’s close.
- Candlestick charts can be confusing, as they are not as simple as line charts or bar charts.
5. CONCLUSION
When trading any candlestick pattern, you should look for confirmation before opening your positions. While candlestick patterns are effective, they do not guarantee future price actions. Therefore, waiting for confirmation signals can minimize the occurrence of false breakouts. There are several ways to confirm signals, such as moving to a lower timeframe to analyze the forex market more thoroughly in terms of current price action.
Today’s article discussed the history of Japanese candlesticks, the components of candlesticks, and how to read candlestick patterns. Additionally, it provided some examples of different patterns. We hope that after reading this article, you have a better understanding of Japanese candlesticks and how to read candlestick patterns for your trading.
Moreover, if you’re interested and would like to learn more about Japanese candlestick patterns, you can check out the book “The Bible of Candlesticks,” which has been compiled and summarized by TradaFX for free.
- t.me/finance_solutes
- Website: https://finance-solutes.com
- Hotline: +1 929 5636 439 ( Hotline )
- 26 Broadway, Suite 934, New York, 10004, US
