
 XM
XM Bybit
Bybit Binance
 Robinhood
 Webull
 IC Markets
 Pepperstone
 OKX
OKX Vantage
 VT Markets
 BingX
BingX Gate.io
 Kucoin
 MEXC
MEXC Exness
 Bitget
CMF is a technical indicator widely used by investors to identify buying and selling pressure and to find reasonable entry points. So, what is CMF? How to set up the CMF indicator on MT4 and TradingView? How to trade effectively using this indicator? All of these questions will be answered in today’s article by Finance Solutes.
1. OVERVIEW OF THE CMF INDICATOR: WHAT IS IT?
CMF stands for Chaikin Money Flow. It is considered a technical indicator used to measure the volume of money flow over a specific period. In addition, this indicator can also be used to identify buying and selling pressure in the market.
1.1. History of the CMF Indicator
The CMF indicator was developed by Marc Chaikin in the 1980s. Chaikin was active in the market as a trader, stockbroker, analyst, and head of the options department at a major Wall Street brokerage firm.
In 2011, he and his team founded Chaikin Analytics – a platform dedicated to providing investors with proven stock trading ideas and analysis.
The Chaikin Money Flow indicator is the result of combining price and trading volume, reflecting the inflow and outflow of money for a given asset over a certain period. Its main purpose is to identify buying/selling pressure based on the movement of money flow.

1.2 CMF Indicator Calculation Formula
The default setting of the CMF indicator is 20 or 21 periods, and you can calculate the Chaikin Money Flow through the following 3 steps:
Step 1: Calculate the Money Flow Multiplier
Money Flow Ratio = [(Closing Price – Low Price) – (High Price – Closing Price)] / (High – Low)
Step 2: Calculate the Money Flow Volume
Cash Flow Volume = Cash Flow Coefficient x Transaction Volume per Period
Step 3: Calculate the 20-Period CMF
CMF 20 Periods = Total 20 Period Money Flow Volume / Total Trading Volume in Each Period.
2. HOW TO SET UP THE CHAIKIN OSCILLATOR ON MT4 AND TRADINGVIEW
In this section, Finance Solu will guide you on how to install the CMF indicator on both the MT4 and TradingView platforms.
2.1. Installing the CMF Indicator on MT4
The CMF indicator is not available by default on the MT4 platform. Therefore, to use this indicator, traders need to download and install it manually into their trading software.
You can download the Chaikin Money Flow Indicator for MT4 HERE.
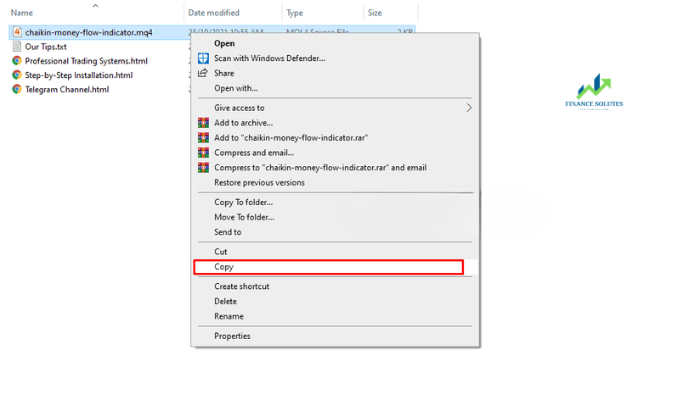
After downloading this indicator to your computer, you proceed to unzip and copy the file chaikin-money-flow-indicator as shown below:
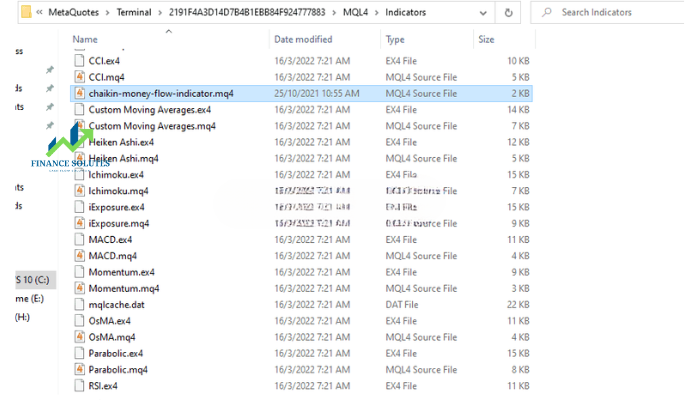
Next, open your MT4 trading platform, then go to: File => Open Data Folder => MQL4 => Indicators. After that, paste the CMF indicator file you copied earlier into this folder.
At this point, Chaikin Money Flow will appear alongside the list of existing indicators on your MT4 platform.
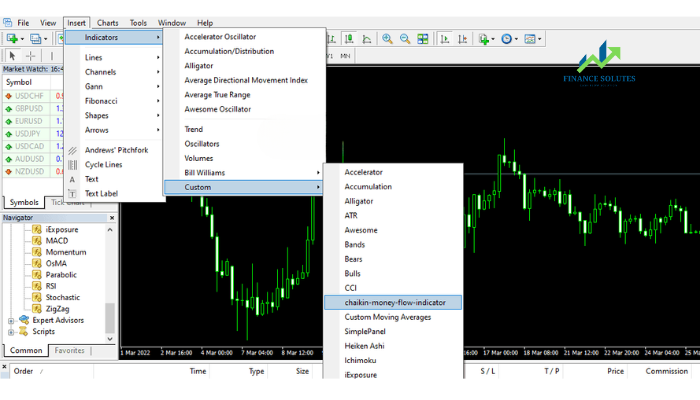
Next, close the MT4 platform and restart it. At this point, the CMF indicator will appear under the Custom section of the Indicators list.
To add the CMF indicator to your chart, go to: Insert => Indicators => Custom => Chaikin Money Flow Indicator, as shown below:
The settings dialog will look like this:
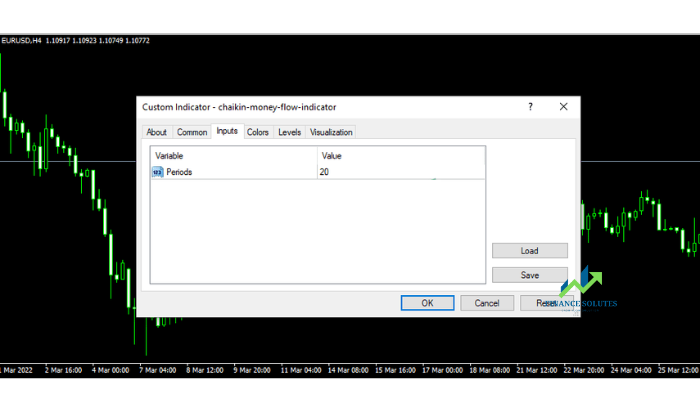
Here, investors only need to pay attention to the Levels, Input, Colors, and Visualization tabs.
- Input: This tab allows you to select the indicator’s period. The system sets the default to 20 periods. If you want to change it, double-click on the number 20 and adjust the period according to your strategy, then click OK.
- Colors: Choose the color of the indicator line.
- Levels: Add or remove any values you wish. In practice, when trading with CMF, investors often add the 0.0 line. To add this, click Add, then enter the value 0.0 in the Level column, and press OK.
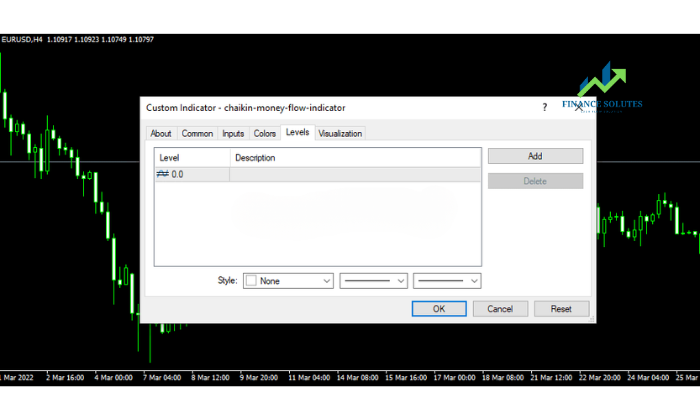
- Visualization: Select the Timeframe on which you want the indicator to be displayed.
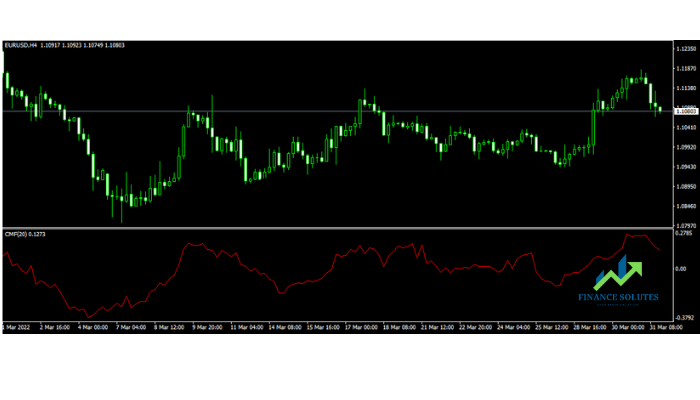
Once successfully configured, the CMF indicator will appear as shown in the image below:
2.2. Installing Chaikin Money Flow on TradingView
Installing this indicator on TradingView is quite simple. You can follow the steps below:
Step 1: Go to the TradingView homepage
Step 2: Click on “Chart”, then select the currency pair (or any asset) you want to analyze.
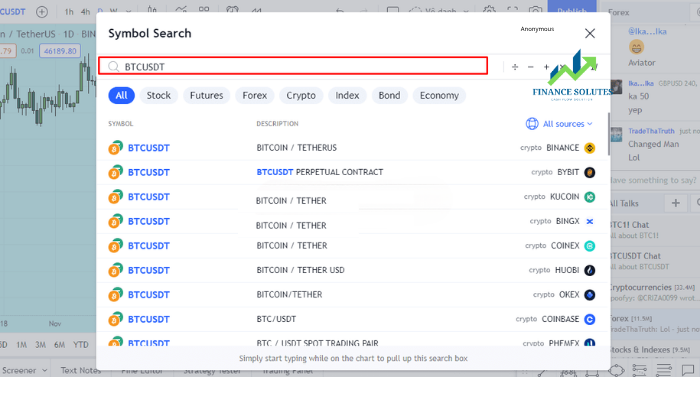
Step 3: Click on the Indicators button on the top toolbar. A search box will appear. Type “CMF” into the search bar, then double-click on Chaikin Money Flow to add the indicator to your chart.
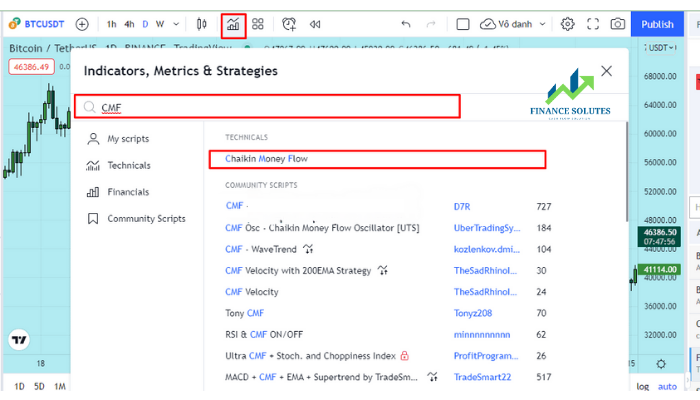
The indicator after successful addition will be displayed as shown below:
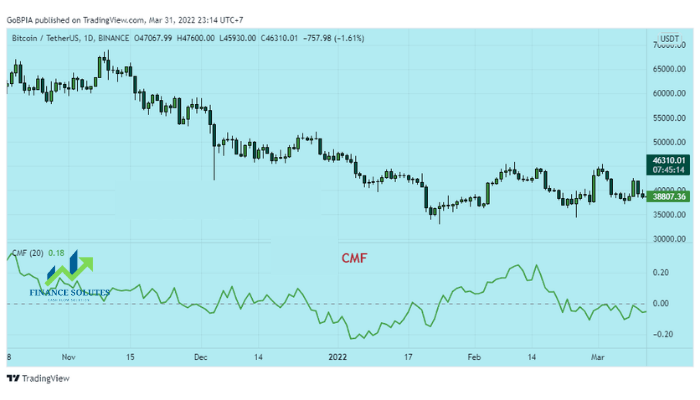
3. RELATED CONTENT ABOUT THE CHAIKIN MONEY FLOW INDICATOR
So, what are the key aspects related to the Chaikin Money Flow (CMF) indicator?
3.1. The Idea Behind the CMF Indicator
The core idea of the CMF indicator is to compare the closing price and volume with the trading range of an asset to determine whether the money flow over a specified period is flowing into or out of the market.
More specifically, when the CMF index increases, it shows that money is flowing into the market and there are more people buying assets. Conversely, when the CMF decreases, it shows that money is starting to flow out of the market and there are more people selling assets.
Initially, Marc Chaikin developed this indicator solely for stock trading. However, today it is widely used across many financial markets, especially in forex, due to the universal nature of money flow dynamics that can apply to any asset or market.
3.2. The correlation between money flow and price

Money flow is the driving force behind price increases or decreases; thus, price is the result of the movement of money flow.
In an uptrend, if money flow also strengthens following the trend, it means the price will rise higher. If money flow decreases, this signals a potential trend reversal. The opposite occurs during a downtrend.
Therefore, money flow usually precedes price movements and must “support” the price for the trend to remain sustainable.
3.3. Chaikin Oscillator Is Suitable for All Types of Assets
According to traditional money flow analysis, assets with large market capitalizations tend to have high trading volumes. Therefore, investors typically consider only large money flows.
However, the CMF indicator removes market capitalization from its calculation formula, making it more widely applicable and suitable for many assets regardless of whether their money flow is large or small.
4. MOST EFFECTIVE TRADING GUIDE WITH CHAIKIN MONEY FLOW
CMF is a very effective indicator for identifying buying and selling pressure in the market. Based on it, you can make reasonable decisions for entry and exit points. The detailed trading method is as follows:
4.1. Trend-following Trading
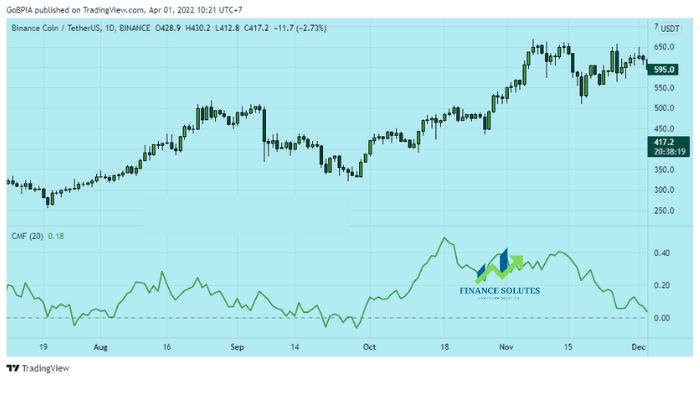
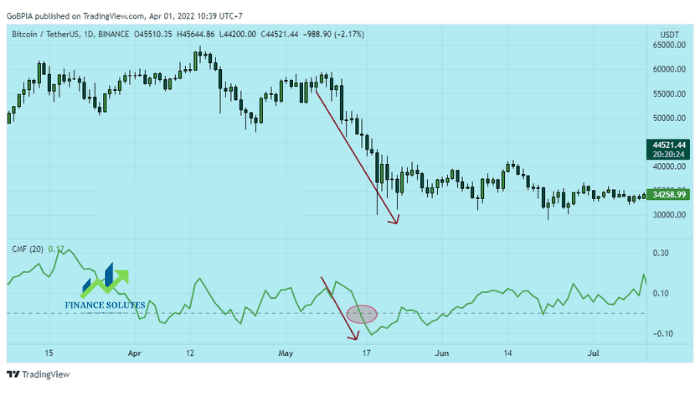
A principle many traders use when trading with the CMF indicator is to take signals based on its oscillation around the 0.0 level.
- When the CMF crosses above 0, this indicates buying pressure is dominant, and you can consider entering a BUY position.
- Conversely, when the CMF crosses below 0, it signals that selling pressure is in control, and you can consider entering a SELL position.
4.2. Trend Confirmation
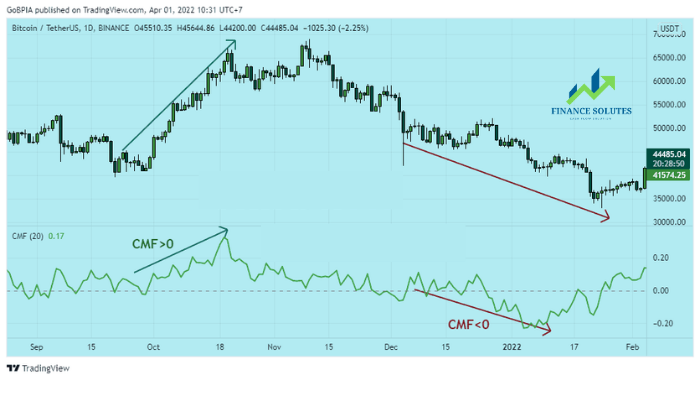
Buying and selling pressure is an effective way to confirm an ongoing trend. This can give traders greater confidence that the current trend is likely to continue.
- In an uptrend, continuous buying pressure (CMF > 0) indicates that the price will keep rising.
- In a downtrend, continuous selling pressure (CMF < 0) indicates that the price will keep falling.
4.3. Price Cross
When the CMF line crosses the zero level, it can signal a potential trend reversal.
- A CMF crossing above 0 from below indicates that the price is likely to start rising afterward.
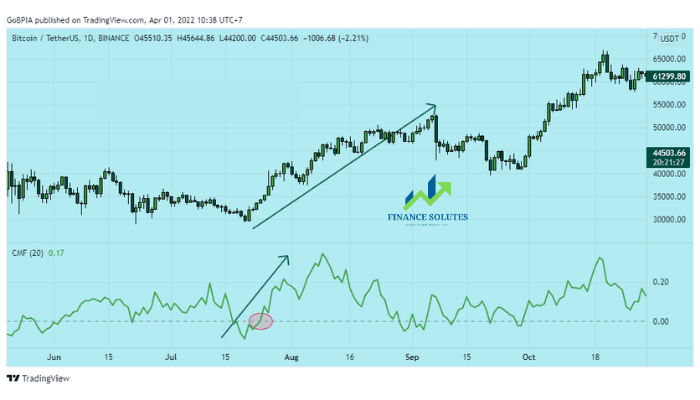
- A CMF crossing below 0 from above indicates that the price is likely to start falling afterward.
4.4. Divergence/Convergence signals between the Chaikin line and price
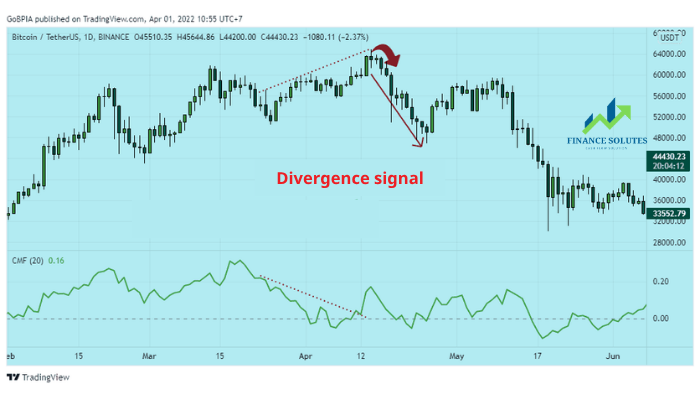
Divergence occurs when the price forms a higher high, but the CMF forms a lower high. This indicates that the strength of the uptrend is weakening, and the market may reverse downward. This is a signal to enter a SELL position.
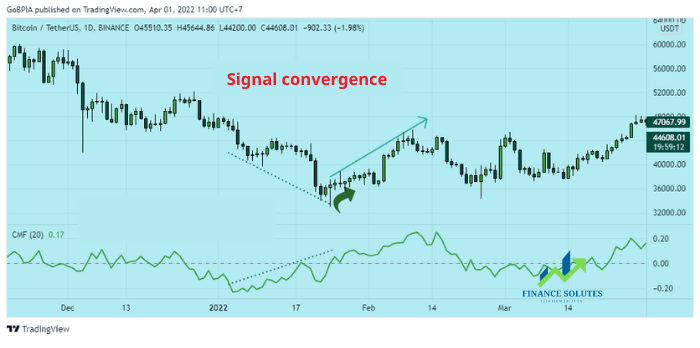
Convergence occurs when the price forms a lower high, but the CMF forms a higher high. This indicates that the downward momentum is weakening, and the market may reverse upward. This is a signal to enter a BUY position.
5. WHAT ARE THE ADVANTAGES AND DISADVANTAGES OF THE CMF INDEX?
In the final part of this article, let’s summarize the strengths and limitations of this indicator.
5.1. Advantages
- One of the most useful indicators in trending markets
- Suitable not only for professional traders but also easy to use for beginner investors
- Can provide effective entry and exit signals
- A powerful tool for identifying the direction of a trend
5.2. Disadvantages
- Investors should not use it as a standalone indicator
- It can give false signals in range-bound market conditions because values may fluctuate around the 0.0 line
- Not effective on smaller timeframes
6. SUMMARY
In today’s article, Finance Solutes has shared with you what the CMF indicator is, how to install CMF on TradingView and MT4, as well as guidance on using this tool most effectively in trading. We hope that with the knowledge provided, you now have a clear understanding of the CMF indicator, know how to use it, and can develop a trading strategy that suits you.
If you have any questions, please leave a comment below the article, and we will respond promptly.
Wishing you success in your trading career!!!
- t.me/finance_solutes
- Website: https://finance-solutes.com
- Hotline: +1 929 5636 439 ( Hotline )
- 26 Broadway, Suite 934, New York, 10004, US
