What is Heiken Ashi Candle? Trading Strategy with Heiken Ashi Candle

The Heiken Ashi indicator, or Heiken Ashi candles, is one of the technical tools developed decades ago to interpret candlestick formations. This tool has been studied for centuries, starting with rice traders in Japan. Heiken Ashi candles are believed to eliminate the “noise” found in traditional Japanese candlestick charts and function similarly to a moving average. So, what is a Heiken Ashi candle? How do you trade using Heiken Ashi candles? Let’s explore in detail with Finance Solutes through the following series of forex knowledge articles.

Let’s get started!!!

1. HEIKEN ASHI INDICATOR

Heikin-Ashi, sometimes also written as Heiken-Ashi, means “average bar” or “average candle” in Japanese, as its price levels are related to average values. The Heikin-Ashi technique can be used in conjunction with candlestick charts when trading stocks to detect market trends and predict future prices. It helps make candlestick charts easier to read and trends easier to analyze.

Heiken Ashi candles, also commonly spelled Heikin Ashi, were developed by Munehisa Homma in the 1700s.

1.1. What is a Heiken Ashi candle?

Similar to the traditional Japanese candlestick pattern you usually see, the Heiken Ashi pattern also features a body and two wicks (shadows). It also has four price levels: high, low, open, and close — but the calculation for these prices is significantly more complex.

The price levels of a traditional Japanese candlestick are determined from the trading session that forms the candle. However, slightly different in the case of the Heiken Ashi pattern, these four price levels also depend on the price data from the previous trading session.
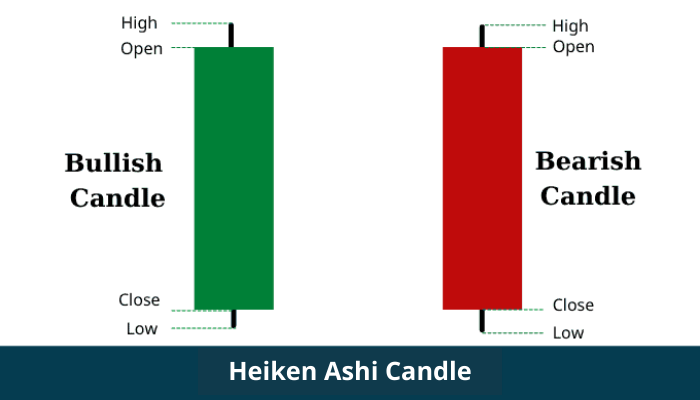
1.2. How to Read Heiken Ashi Candles (How to View a Heiken Ashi Chart)

So, what is the formula for calculating the price levels of a Heiken Ashi candle?

Open price is the average of the open and close prices of the previous trading session (previous candle):

  • Open = (Open of Previous Bar + Close of Previous Bar) / 2

Close price is the average of the four price levels (open, close, high, and low) of the current trading session:

  • Close = (Open + Close + High + Low) / 4

High price is the maximum value among the open, close, and the highest price reached during the current session:

  • High = Max (High, Open, Close)

Low price is the minimum value among the open, close, and the lowest price reached during the current session:

  • Low = Min (Low, Open, Close)

1.3. Heiken Ashi Candles Compared to Japanese Candlesticks

To compare a Heiken Ashi chart with a traditional Japanese candlestick chart, you can refer to the example below: EUR/USD pair on the Daily timeframe, within the same period.
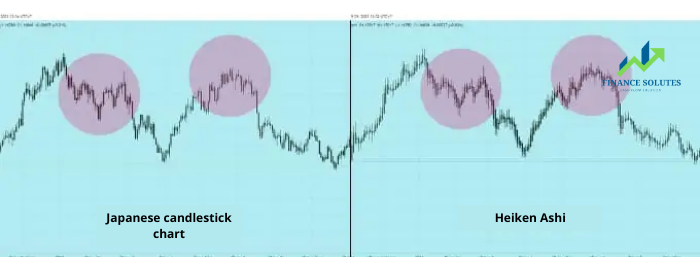
The first noticeable difference is that the Heiken Ashi chart appears fuller, thicker, and more closely packed compared to the traditional Japanese candlestick chart. This is because in standard Japanese candlestick charts, the opening price of the next session is usually equal to the closing price of the previous session (unless a GAP appears); the candles are connected from wick to wick. In contrast, with Heiken Ashi, the next candle starts approximately in the middle of the previous one, so GAPs never appear on a Heiken Ashi chart. This is a key feature that distinguishes Japanese candlestick charts from Heiken Ashi charts.

Next, in terms of price movement trends, both charts reflect a similar direction, but the Heiken Ashi chart appears smoother than the Japanese candlestick chart.

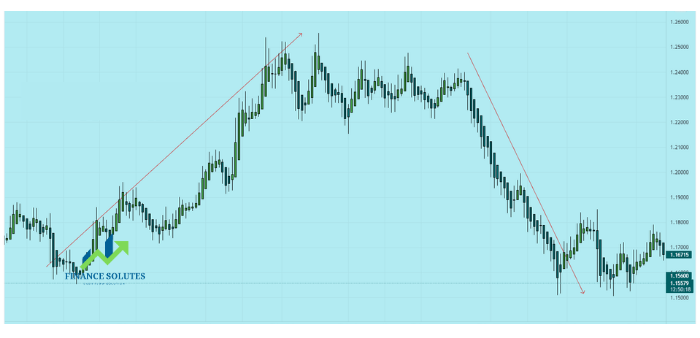
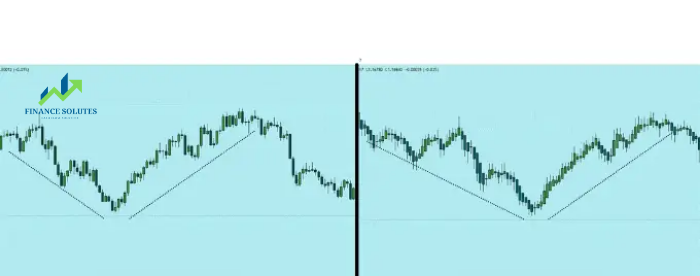
In the two trend segments—downtrend and uptrend—highlighted in the image below, the Heiken Ashi chart shows the downtrend with mostly bearish candles (blue) and the uptrend with mostly bullish candles (green). Meanwhile, on the traditional Japanese candlestick chart, the downtrend still includes some bullish candles, and the uptrend still includes some bearish candles.
2. INSTALLING HEIKEN ASHI CANDLES

In this section, Finance Solutes will guide you on how to install the Heiken Ashi indicator on the MT4 and TradingView trading platforms.

2.1. Installing Heiken Ashi Candles on TradingView

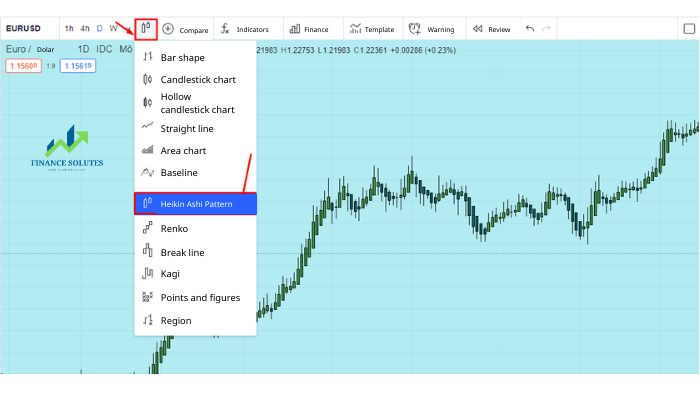
So how can you enable/disable the Heiken Ashi chart on TradingView?

It’s very simple. On the chart of any currency pair, go to the toolbar, click on the candle icon (as shown in the image below), then select the Heikin Ashi chart type.

To disable the Heiken Ashi chart, simply do the same steps and select Candlestick Chart.

2.2. Installing Heiken Ashi Candles on MT4

To install Heiken Ashi candles on MT4, follow these steps:

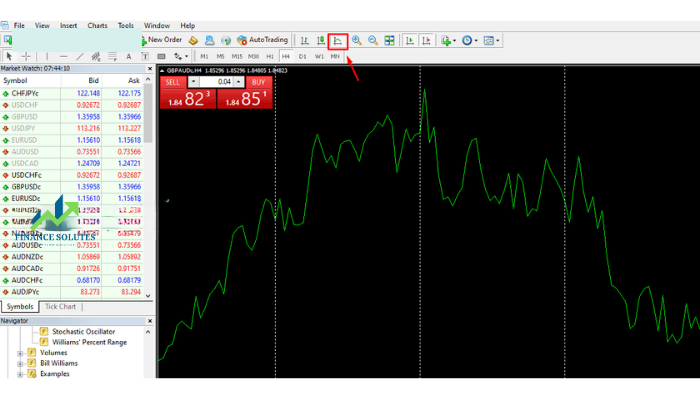
Step 1: On the toolbar, click the Line Chart icon; the price chart will switch to line format, as shown below:

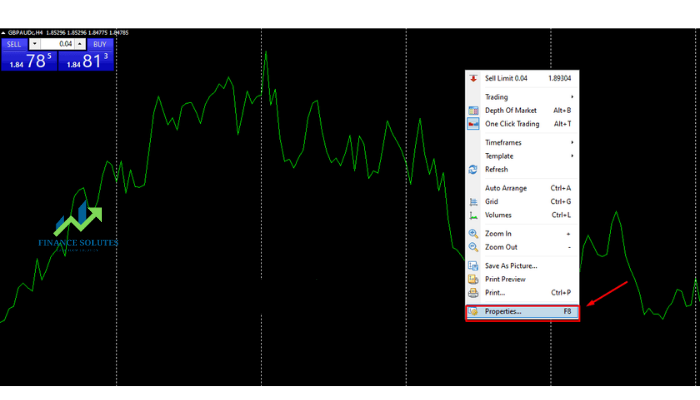
Step 2: Right-click on the price graph and select Properties.

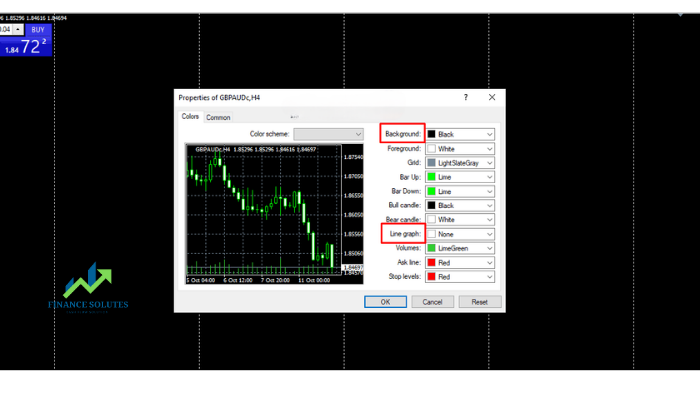
The chart settings dialog box will appear as shown below:

You need to pay attention to two sections: Background and Line Graph. In the Line Graph box, select None.

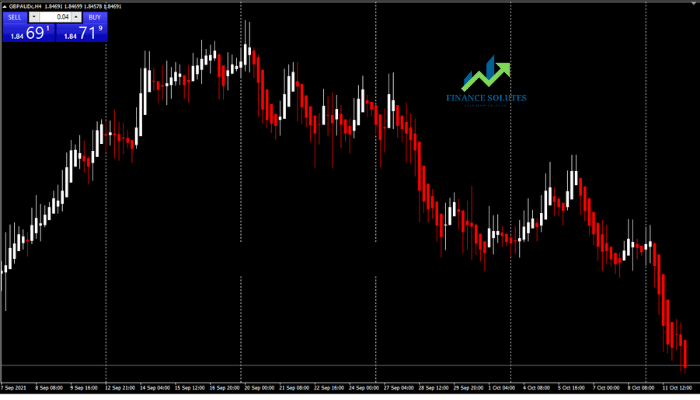
The Heiken Ashi candles are by default colored red (for bearish candles) and white (for bullish candles) on MT4. However, you can change these colors according to your preferences.

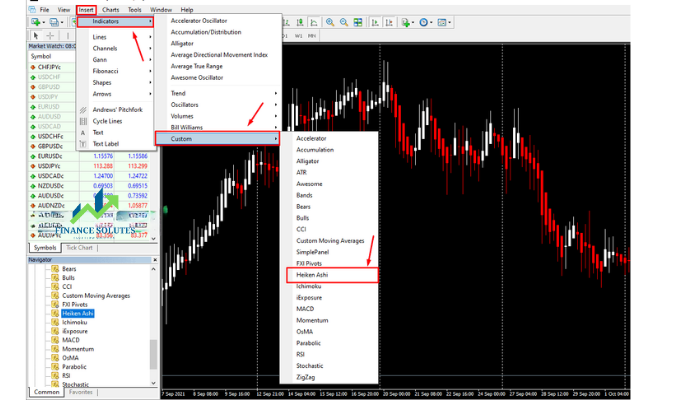
Step 3: On the toolbar, add Heiken Ashi by following these steps: Insert => Indicators => Custom => Heiken Ashi.

Once the indicator dialog appears, click OK, and you’re all set.

Now, this is the Heiken Ashi chart displayed on MT4:

To remove the Heiken Ashi indicator and switch back to the regular candlestick chart, simply right-click on any Heiken Ashi candlestick on the chart, then choose Delete Indicator. Next, on the toolbar, click the candlestick chart icon, and you’re all set.

Additionally, you can also set up Heiken Ashi on your mobile device (Heiken Ashi mobile) in a very simple way, similar to how you would do it on your computer.

3. HEIKEN ASHI 2-CANDLE REVERSAL PATTERN

Just like Japanese candlesticks, Heiken Ashi candles also have reversal patterns for trading signals.

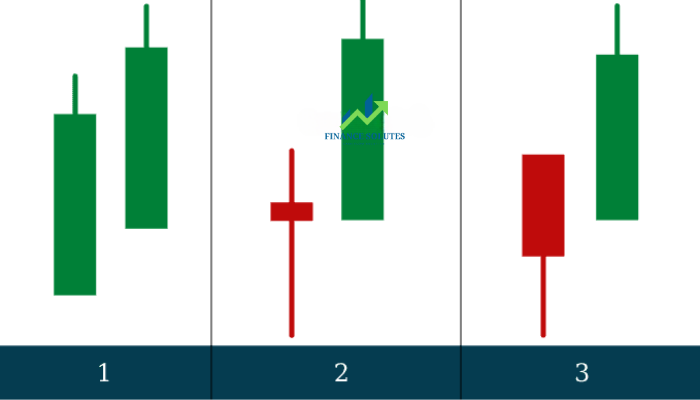
3.1. Heiken Ashi 2-Candle Bullish Reversal Pattern

Below, Finance Solutes summarizes some common 2-candle bullish reversal patterns that traders often encounter on trading charts:

The pattern appears after a strong downtrend:

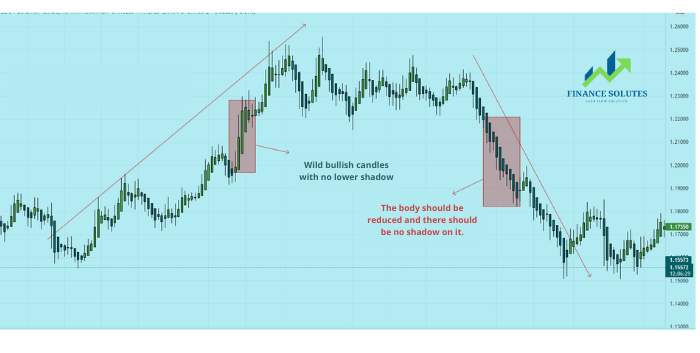
  1. The first Heiken Ashi candle is a strong bullish candle with no lower wick; the second candle is also strongly bullish with no lower wick.
  2. The first candle is a Heiken Ashi Doji (which can be either bullish or bearish); the second candle is strongly bullish with no lower wick.
  3. The first candle is a strong bearish Heiken Ashi candle (with or without a wick); the second candle is a strong bullish candle with no lower wick.

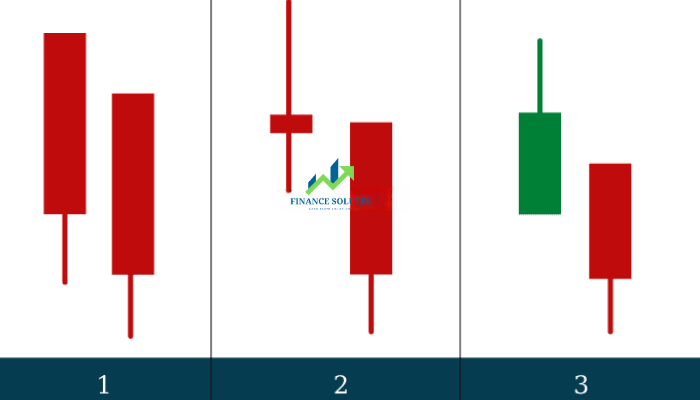
3.2. Heiken Ashi 2-Candle Bearish Reversal Pattern

Here are some Heiken Ashi 2-candle bearish reversal patterns that traders should be aware of:

The pattern appears after a strong uptrend:

  1. The first Heiken Ashi candle is a strong bearish candle with no upper wick; the second candle is also a strong bearish candle with no upper wick.
  2. The first candle is a Heiken Ashi Doji (which can be either bullish or bearish); the second candle is strongly bearish with no upper wick.
  3. The first Heiken Ashi candle is a strong bullish candle (with or without a wick); the second candle is a strong bearish candle with no upper wick.

4. HEIKEN ASHI METHOD IN FOREX

Thanks to its averaging properties, the Heiken Ashi indicator works best for identifying and confirming trend signals. Moreover, it makes it easier to recognize price patterns.

4.1. Identifying Trends

With the Heiken Ashi indicator, identifying trends becomes incredibly simple due to the unique characteristics of the candles that form the trend—something that traditional candlestick charts cannot achieve.

In an uptrend, the number of bullish candles appears overwhelmingly and consistently; bearish candles are rare, and sometimes no bearish candles appear if the uptrend is strong. The bullish candles forming the uptrend generally have long upper wicks and very short or no lower wicks.

You can observe a real-life example on the EUR/USD daily chart. Here, bullish candles are green, while bearish candles are blue.

As observed, in a downtrend, green candles only appear during market retracements, while during the declines, the number of blue candles always dominates.

The consecutive blue Heiken Ashi candles in a downtrend usually have no upper wicks or only very short ones.

4.2 Providing Buy/Sell Signals

Buy Signal

When the chart shows a series of (at least 3 consecutive) bullish Heiken Ashi candles with long bodies, long upper wicks, and short or no lower wicks, it indicates that the market is in an uptrend and will likely continue to rise. This is a good opportunity to enter a Buy position.

Sell Signal

When a series of (at least 3 consecutive) bearish Heiken Ashi candles appear with long bodies, long lower wicks, and short or no upper wicks, it indicates that the market is in a downtrend and will likely continue to fall. This is a good opportunity to enter a Sell position.

4.3 Providing Reversal Signals

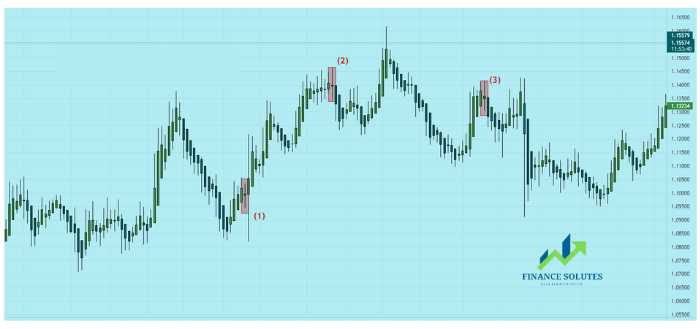
The Heiken Ashi candlestick pattern that provides reversal signals is the Doji candle. The characteristics of a Heiken Ashi Doji are similar to the Doji candle in a traditional Japanese candlestick chart – it has a short body (almost a straight line) with long upper and lower wicks.

When a Heiken Ashi Doji appears during a trend, it indicates that the market is indecisive. Two possibilities can occur:

  1. The market is temporarily resting before the main trend resumes.
  2. The dominant side’s momentum is weakening, creating an opportunity for the opposing side to enter the market, which could lead to a trend reversal.

In the image above, after the Doji candle (1) appears, the price trend continues; meanwhile, Doji candles (2) and (3) appear and result in a trend reversal.

4.4. Better Identification of Chart Patterns

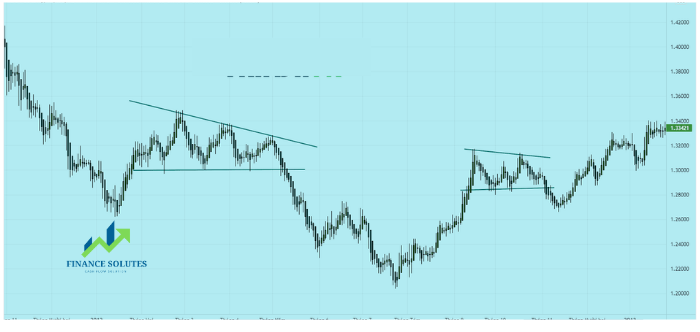
Thanks to characteristics such as dense candles, closer proximity; fewer lower wicks in an uptrend and fewer upper wicks in a downtrend; and the removal of “noise,” the Heiken Ashi chart helps identify better chart patterns. Among them, the Wedge and Triangle patterns are the two most frequently appearing patterns on Heiken Ashi charts.

Identifying these two chart patterns will become easier, so the most important thing is to determine an effective trading strategy with these candlestick patterns.

5. STRATEGY WITH HEIKEN ASHI CANDLES COMBINED WITH EMA

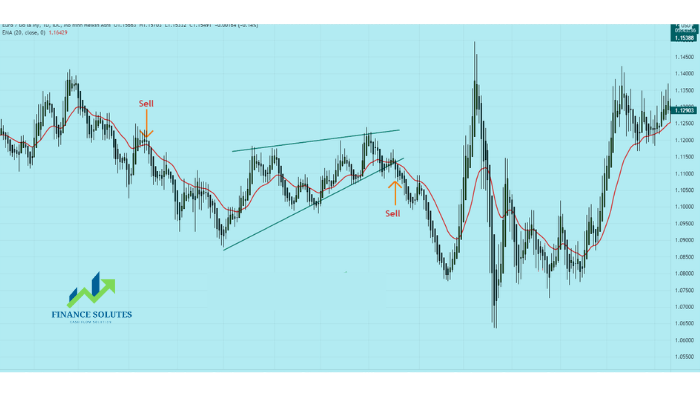
In this strategy, Finance Solutes will use the pullback trading technique on the candlestick chart and employ Heiken Ashi candles along with the candle wicks to help confirm trading signals.

Note that the higher the time frame, the more accurate the signals will be.

Important notes when using the strategy:

  • Time frame: D1
  • Use the EMA 20 line to track pullbacks
  • Trend confirmed by the Heiken Ashi chart
  • Use the color change of Heiken Ashi candles to determine entry points.

Real-life example of the EMA Heiken Ashi combined trading method:

Observe the chart below for the EURUSD pair on the Daily timeframe, the EMA line shows the dominant trend on the D1 timeframe. When the Heiken Ashi candle color changes, wait for the price pattern and the EMA 20 to confirm a trend change, then look for a selling opportunity.

6. SUMMARY

In today’s article, Finance Solutes has introduced you to what Heiken Ashi candles are, how to install Heiken Ashi candles on MT4 and TradingView, and provided effective Forex trading methods using this candlestick chart. We hope that what we have presented will be helpful to you in your forex investment and trading journey.

Wishing you success in your trading career!!!

🌍 Finance Solutes
  • t.me/finance_solutes
  • Website: https://finance-solutes.com
  • Hotline: +1 929 5636 439 ( Hotline )
  • 26 Broadway, Suite 934, New York, 10004, US